
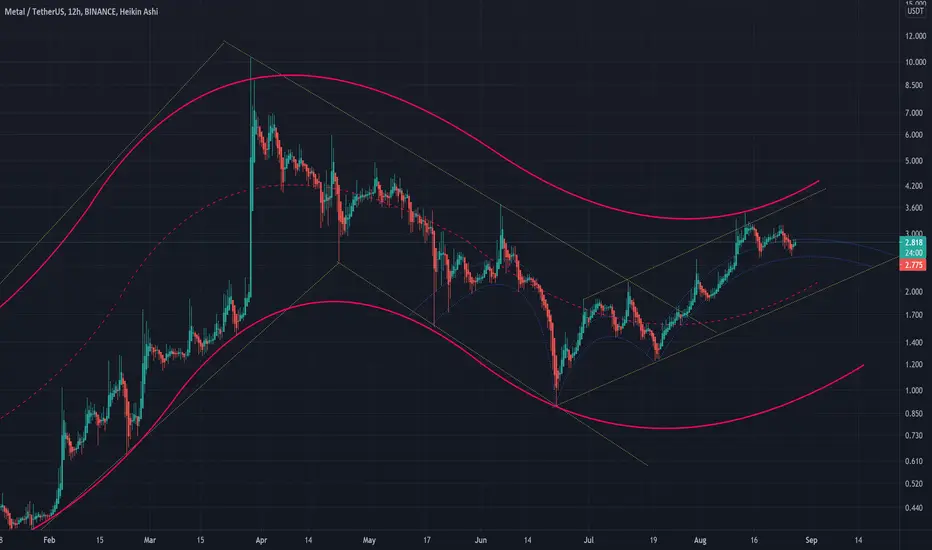
This is a curved projection channel created upon a bounding box. The chart is presented over a LOG price scale. For its creation we use 3 "curved line boundaries" that cover the center, upper and lower limits for potential movement. Even if this not an attempt to forecast a trend or future scenario, it allows to have an easy to read view of probable limits and oscillation parameters.
Just sharing my personal charts for learning purposes only. This is not an investment recommendation.
Just sharing my personal charts for learning purposes only. This is not an investment recommendation.
註釋
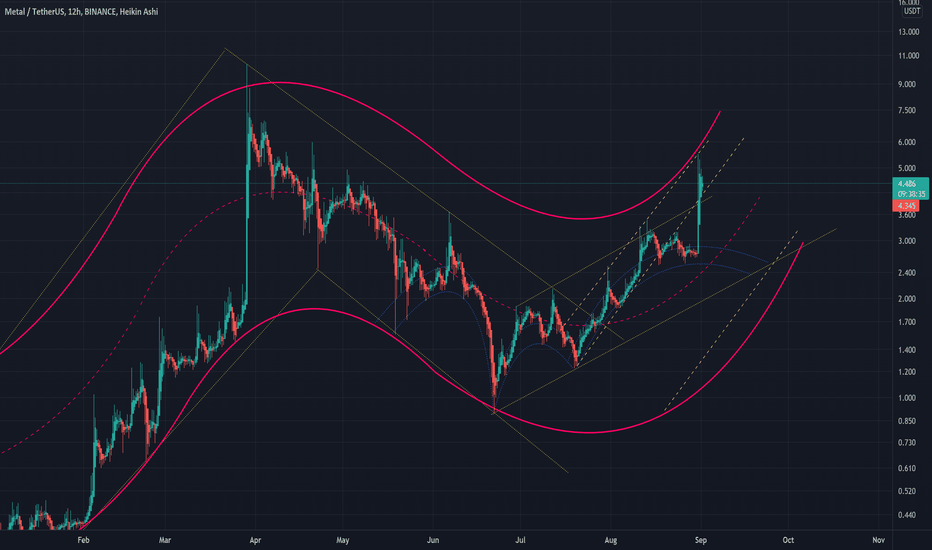
CORRECTED CHARTI did really miscalculated the slope on this one. This is the corrected update

免責聲明
這些資訊和出版物並非旨在提供,也不構成TradingView提供或認可的任何形式的財務、投資、交易或其他類型的建議或推薦。請閱讀使用條款以了解更多資訊。
免責聲明
這些資訊和出版物並非旨在提供,也不構成TradingView提供或認可的任何形式的財務、投資、交易或其他類型的建議或推薦。請閱讀使用條款以了解更多資訊。