
Date: June 9, 2025
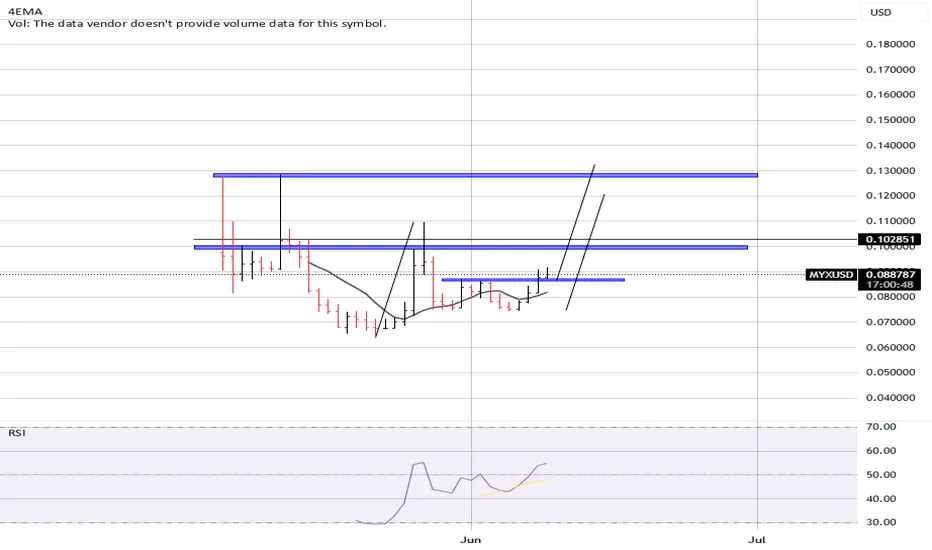
MYX/USDT is showing a classic bullish setup, forming a tight consolidation just below a key resistance zone. This structure often precedes a breakout, especially when combined with increasing momentum indicators.
📊 Technical Overview:
Current Price: $0.08894
Immediate Resistance: $0.10285
EMA Signal: Price is holding above the 4EMA, suggesting short-term bullish momentum is intact.
📈 Indicators:
RSI: Currently at 54.81 — neutral to bullish, with room for upside before entering overbought territory.
Volume: Not provided on this chart, but the structure and price action suggest accumulation.
🔍 Chart Structure:
The price is forming higher lows and pressing against horizontal resistance, indicating bullish pressure.
A clean break and close above the $0.102–$0.103 zone would likely trigger a strong move toward higher targets.
🎯 Targets:
First Target: $0.10285 (resistance breakout level)
Second Target: $0.13000 (next major horizontal resistance, matching past supply zone)
📉 Invalidation Level:
A break below $0.080 and loss of higher low structure would invalidate the bullish thesis and suggest further range-bound action or a correction.
交易進行
going very good after a bit of drawdown :-) 交易結束:目標達成
we have made really great profits in here.great winner of the year ;-)

Who Dares always Wins!
My contact on Telegram: @Etelve
My contact on Telegram: @Etelve
免責聲明
這些資訊和出版物並非旨在提供,也不構成TradingView提供或認可的任何形式的財務、投資、交易或其他類型的建議或推薦。請閱讀使用條款以了解更多資訊。
Who Dares always Wins!
My contact on Telegram: @Etelve
My contact on Telegram: @Etelve
免責聲明
這些資訊和出版物並非旨在提供,也不構成TradingView提供或認可的任何形式的財務、投資、交易或其他類型的建議或推薦。請閱讀使用條款以了解更多資訊。