
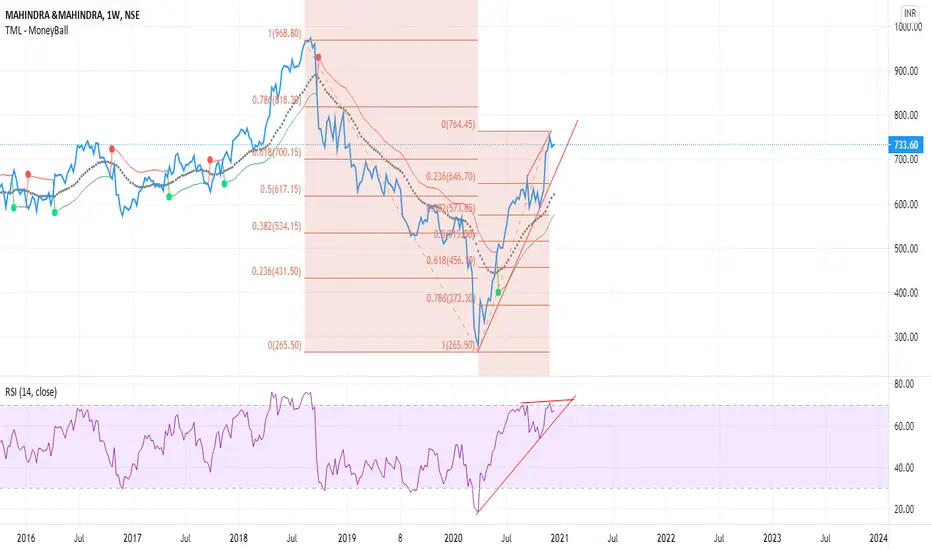
M&M on weekly time frames is poised to correct.
Currently, hidden negative divergences are clearly visible on the chart.
Even though, the price has established a new high post-September 2020 however, RSI failed to establish a new high and its the first sign of loss of momentum.
Applying the Elliot wave theory
From march lows of 250 and recent highs of 760 - we can consider this as wave 1
Wave 2 - Usually corrects up to 61.% fibo levels which comes down to 450. However, 570 & 500 are also crucial levels to watch for any reversal signs.
Currently, hidden negative divergences are clearly visible on the chart.
Even though, the price has established a new high post-September 2020 however, RSI failed to establish a new high and its the first sign of loss of momentum.
Applying the Elliot wave theory
From march lows of 250 and recent highs of 760 - we can consider this as wave 1
Wave 2 - Usually corrects up to 61.% fibo levels which comes down to 450. However, 570 & 500 are also crucial levels to watch for any reversal signs.
註釋
M&M saw a massive fall of over 7% today and made a low of 660. 640-650 is strong support since its 23.6% fibbo level... it is likely the stock will bounce from these levels to further test the 570-500 levels in future.

免責聲明
這些資訊和出版物並非旨在提供,也不構成TradingView提供或認可的任何形式的財務、投資、交易或其他類型的建議或推薦。請閱讀使用條款以了解更多資訊。
免責聲明
這些資訊和出版物並非旨在提供,也不構成TradingView提供或認可的任何形式的財務、投資、交易或其他類型的建議或推薦。請閱讀使用條款以了解更多資訊。