
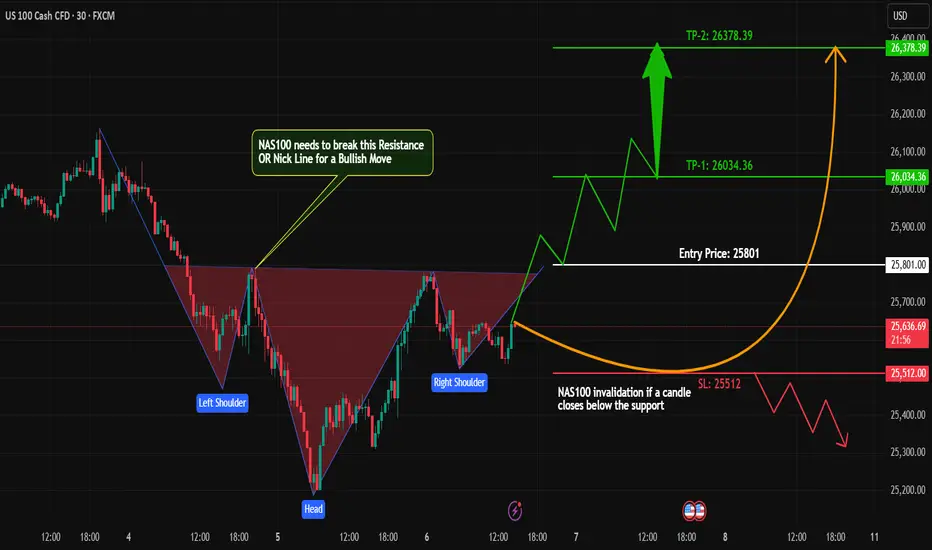
#NAS100 has been moving sideways on the higher time frames, showing consolidation after recent volatility. However, on the 30-minute chart, it’s now forming a clean Inverse Head & Shoulders pattern, which is a classic bullish reversal signal.
Key Levels to Watch:
Neckline Breakout Zone: Watch for a breakout above the neckline for confirmation of bullish momentum.
Entry Plan: Wait for a break and retest of the neckline before entering a long position.
Targets: Short-term resistance zones and Fibonacci extensions can be used for profit booking.
Risk Management: Always use a tight stop-loss below the right shoulder to protect capital.
Technical Outlook:
Once the neckline is broken with volume confirmation, it may trigger a strong bullish continuation move — aligning with broader market momentum.
What’s your view on this setup?
Do you see a breakout coming soon, or another fakeout before the move? Share your thoughts below
#NAS100 #Trading #PriceAction #ChartAnalysis #TechnicalAnalysis #HeadAndShoulders #Forex #Indices #DayTrading
Key Levels to Watch:
Neckline Breakout Zone: Watch for a breakout above the neckline for confirmation of bullish momentum.
Entry Plan: Wait for a break and retest of the neckline before entering a long position.
Targets: Short-term resistance zones and Fibonacci extensions can be used for profit booking.
Risk Management: Always use a tight stop-loss below the right shoulder to protect capital.
Technical Outlook:
Once the neckline is broken with volume confirmation, it may trigger a strong bullish continuation move — aligning with broader market momentum.
What’s your view on this setup?
Do you see a breakout coming soon, or another fakeout before the move? Share your thoughts below
#NAS100 #Trading #PriceAction #ChartAnalysis #TechnicalAnalysis #HeadAndShoulders #Forex #Indices #DayTrading
取消訂單
Trade is not Valid. 
免責聲明
這些資訊和出版物並非旨在提供,也不構成TradingView提供或認可的任何形式的財務、投資、交易或其他類型的建議或推薦。請閱讀使用條款以了解更多資訊。
免責聲明
這些資訊和出版物並非旨在提供,也不構成TradingView提供或認可的任何形式的財務、投資、交易或其他類型的建議或推薦。請閱讀使用條款以了解更多資訊。