
Hello Traders,
welcome to this free and educational multi-timeframe technical analysis .
On the weekly timeframe you can see that nas100 is actually approaching a quite obvious previous weekly structure area which is now acting as resistance at the $15.000 level.
You can also see that over the past couple of weeks, nas100 had a massively bullish rally and we are now a little bit overextended towards the upside, so I am now just waiting for a deeper push into the zone and then I do expect a short term rejection towards the downside.
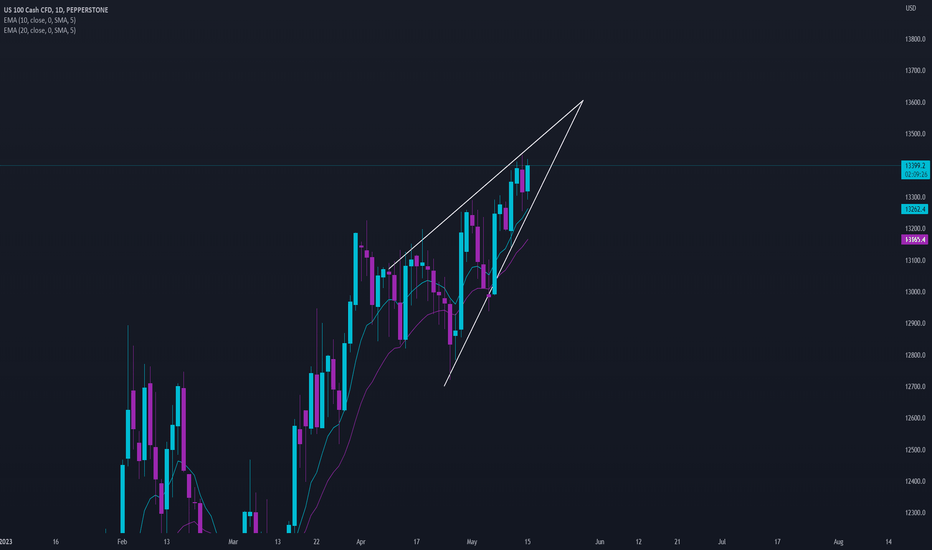
On the daily timeframe you can also see that we are just rallying towards the upside without any correction, so I am now just waiting for some bearish rejection before I then do expect a short term drop also on the daily timeframe.
Thank you for watching and I will see you tomorrow!
You can also check out my previous analysis of this asset:
welcome to this free and educational multi-timeframe technical analysis .
On the weekly timeframe you can see that nas100 is actually approaching a quite obvious previous weekly structure area which is now acting as resistance at the $15.000 level.
You can also see that over the past couple of weeks, nas100 had a massively bullish rally and we are now a little bit overextended towards the upside, so I am now just waiting for a deeper push into the zone and then I do expect a short term rejection towards the downside.
On the daily timeframe you can also see that we are just rallying towards the upside without any correction, so I am now just waiting for some bearish rejection before I then do expect a short term drop also on the daily timeframe.
Thank you for watching and I will see you tomorrow!
You can also check out my previous analysis of this asset:

#1 Video Author on @TradingView 🏆
Swing Trader since the Year 2019 💻
Daily Analysis from Monday - Friday 💰
4K+ Traders in Our FREE Community👇
discord.gg/jgdrYXwqyD
Swing Trader since the Year 2019 💻
Daily Analysis from Monday - Friday 💰
4K+ Traders in Our FREE Community👇
discord.gg/jgdrYXwqyD
相關出版品
免責聲明
這些資訊和出版物並非旨在提供,也不構成TradingView提供或認可的任何形式的財務、投資、交易或其他類型的建議或推薦。請閱讀使用條款以了解更多資訊。
#1 Video Author on @TradingView 🏆
Swing Trader since the Year 2019 💻
Daily Analysis from Monday - Friday 💰
4K+ Traders in Our FREE Community👇
discord.gg/jgdrYXwqyD
Swing Trader since the Year 2019 💻
Daily Analysis from Monday - Friday 💰
4K+ Traders in Our FREE Community👇
discord.gg/jgdrYXwqyD
相關出版品
免責聲明
這些資訊和出版物並非旨在提供,也不構成TradingView提供或認可的任何形式的財務、投資、交易或其他類型的建議或推薦。請閱讀使用條款以了解更多資訊。