
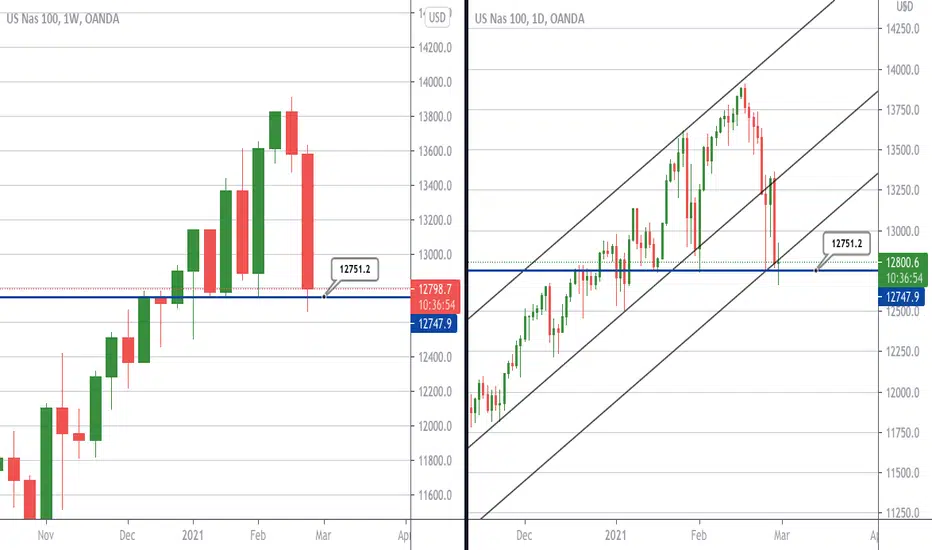
Nasdaq analysis Daily/Weekly TF
Nasdaq is back at this very crucial point. where the price has come many times this year but failed to break. Will it break this time? You can see on the left hand side the weekly timeframe how many times it has come and touched or attempted to break but failed everytime. On the right hand side we have the daily timeframe we can see it is still a overall bullish trend. a failed break can probably make this bullish trend continue maybe taking us to new highs. One thing for sure when it moves it will move fast.
Nasdaq is back at this very crucial point. where the price has come many times this year but failed to break. Will it break this time? You can see on the left hand side the weekly timeframe how many times it has come and touched or attempted to break but failed everytime. On the right hand side we have the daily timeframe we can see it is still a overall bullish trend. a failed break can probably make this bullish trend continue maybe taking us to new highs. One thing for sure when it moves it will move fast.

免責聲明
這些資訊和出版物並非旨在提供,也不構成TradingView提供或認可的任何形式的財務、投資、交易或其他類型的建議或推薦。請閱讀使用條款以了解更多資訊。
免責聲明
這些資訊和出版物並非旨在提供,也不構成TradingView提供或認可的任何形式的財務、投資、交易或其他類型的建議或推薦。請閱讀使用條款以了解更多資訊。