
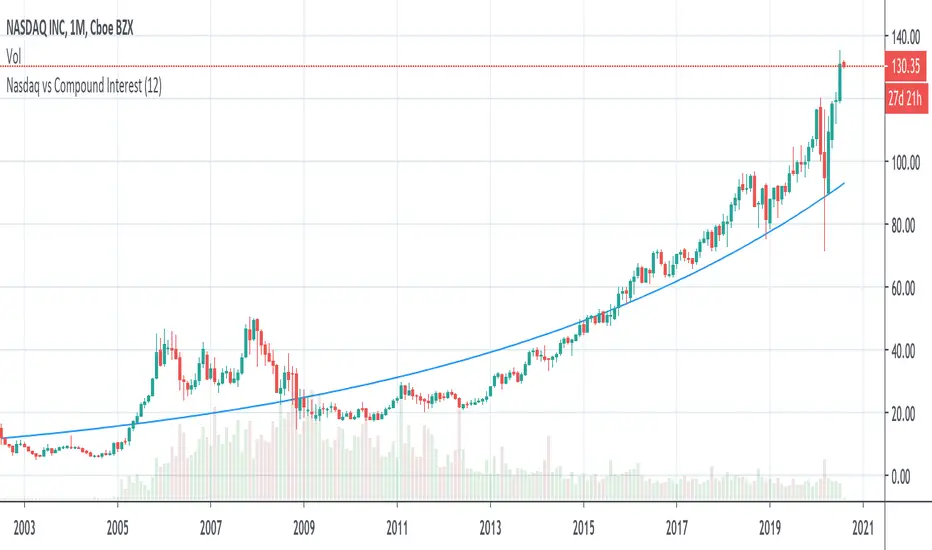
By comparing Nasdaq with historical returns it seems Nasdaq returns are aligning with 12% annually compounded rate. If Nasdaq has similar potential in the future this graph can help in understanding oversold or overbought positions for the long term.
If the index is far below the compounding rate line, it indicates that the index has the potential to give more returns down the line. The longer gap and longer duration have a higher probability.
If the index is far below the compounding rate line, it indicates that the index has the potential to give more returns down the line. The longer gap and longer duration have a higher probability.

免責聲明
這些資訊和出版物並非旨在提供,也不構成TradingView提供或認可的任何形式的財務、投資、交易或其他類型的建議或推薦。請閱讀使用條款以了解更多資訊。