
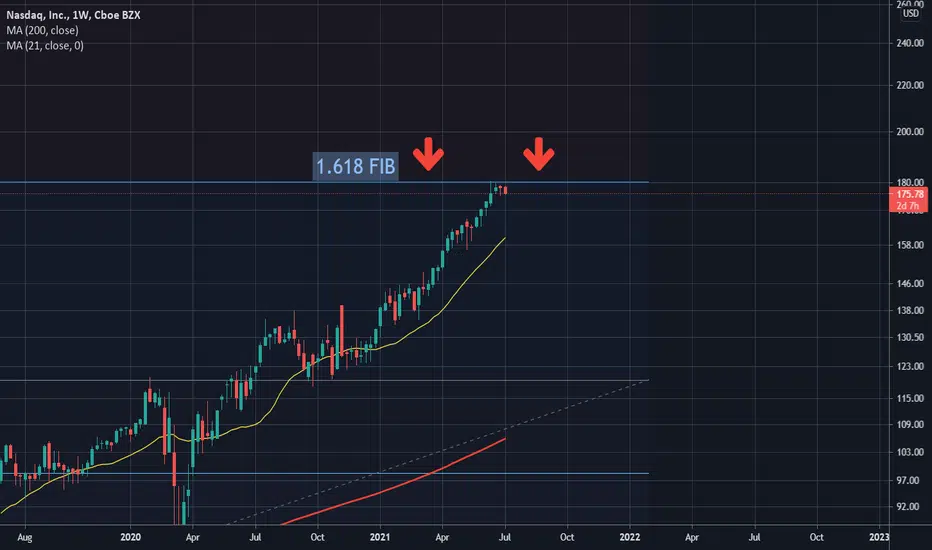
The weekly chart of the Nasdaq index is showing weakness with multiple weekly candle rejections at exactly the 1.618 fibonacci extension level.
This is key to note as the 1.618 as many know is often the first place traders short, sell and or take profits after price breaks all time high. So paying attention to the $180 level will be important. If bulls can ever get a weekly close above this level, the run up can continue.
Until then, proceed with caution this week and probably the next if your portfolio is very tech stock heavy.
This is key to note as the 1.618 as many know is often the first place traders short, sell and or take profits after price breaks all time high. So paying attention to the $180 level will be important. If bulls can ever get a weekly close above this level, the run up can continue.
Until then, proceed with caution this week and probably the next if your portfolio is very tech stock heavy.

免責聲明
這些資訊和出版物並非旨在提供,也不構成TradingView提供或認可的任何形式的財務、投資、交易或其他類型的建議或推薦。請閱讀使用條款以了解更多資訊。