
I'm surprised that no one on Trading View posted this chart today.
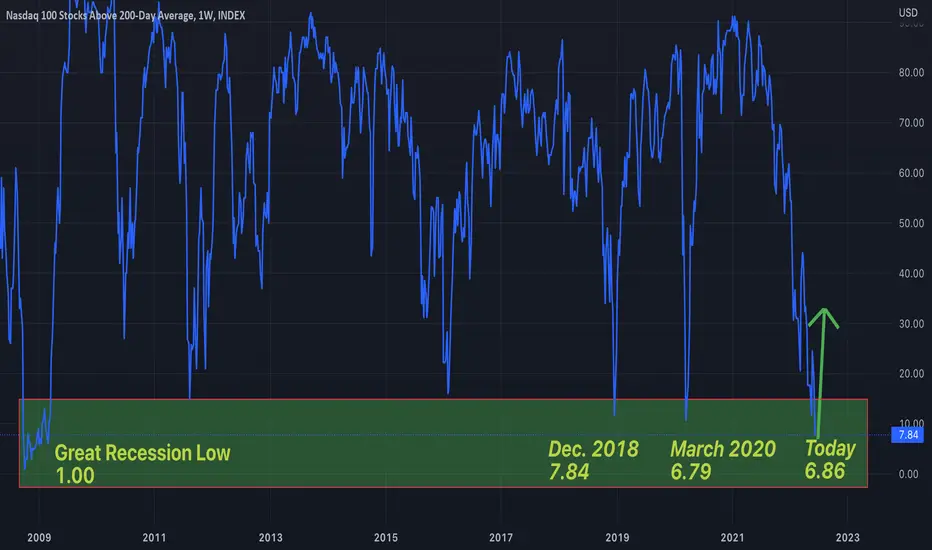
The NDTH is a chart of the percentage of Nasdaq 100 stocks that are above their 200-day moving average. It dropped to 6.86 today. This means about 94% of Nasdaq 100 stocks were below their 200-day moving average. The last time this level was reached was in March 2020 right at the bottom of the COVID market crash. The NDTH has never dropped below 15 except during significant bottoms on the Nasdaq.
While anything is possible, it's highly likely that we are seeing peak fear, peak inflation, and market capitulation currently. This extreme level makes for a very good risk-to-reward setup for going long. My strategy is to place a 2x daily ATR stop loss on QQQ or TQQQ. It's likely if we drop below this level then we're in for a deep recession. Whereas if this low holds, then this is a major bottom for tech.
交易結束:目標達成
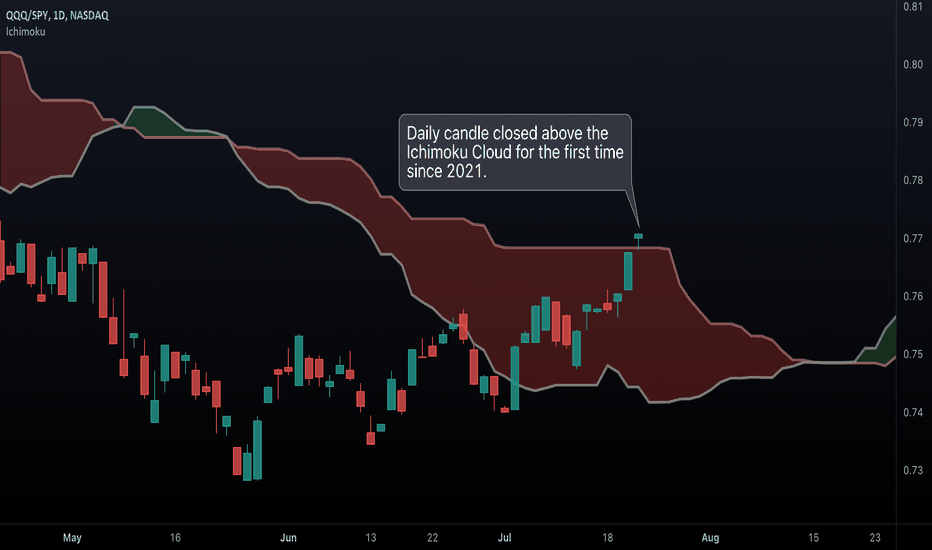
Took profit on my long tech position in early August 2022. This trade idea was an intermediate-term idea.For an updated perspective on tech, you can view this post:

免責聲明
這些資訊和出版物並非旨在提供,也不構成TradingView提供或認可的任何形式的財務、投資、交易或其他類型的建議或推薦。請閱讀使用條款以了解更多資訊。
免責聲明
這些資訊和出版物並非旨在提供,也不構成TradingView提供或認可的任何形式的財務、投資、交易或其他類型的建議或推薦。請閱讀使用條款以了解更多資訊。