
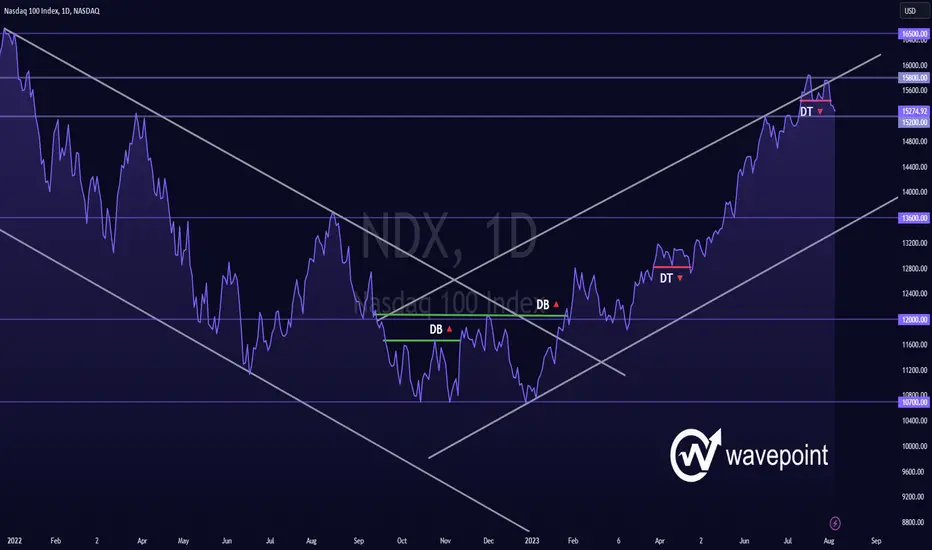
🔹Index shows NEGATIVE signal from double top formation, broke support at 15426.
🔹Signals further decline to 15057 or lower.
🔹Supports 13600 and resistance at 15800
🔹Technically NEUTRAL for medium long-term.
Chart Pattern;
🔹DT - Double Top | BEARISH | 🔴
🔹DB - Double Bottom | BULLISH | 🟢
🔹HNS - Head & Shoulder | BEARISH | 🔴
🔹REC - Rectangle | 🔵
🔹iHNS - inverse head & Shoulder | BULLISH | 🟢
Verify it first and believe later.
WavePoint ❤️

The most profitable U.S. Stock VIP Signals Provider in Telegram Channel | Check our latest product updates: bit.ly/wavepoint-vip |
For more info:
Telegram: t.me/Wel_99
X: x.com/wavepoint99
For more info:
Telegram: t.me/Wel_99
X: x.com/wavepoint99
相關出版品
免責聲明
這些資訊和出版物並非旨在提供,也不構成TradingView提供或認可的任何形式的財務、投資、交易或其他類型的建議或推薦。請閱讀使用條款以了解更多資訊。