
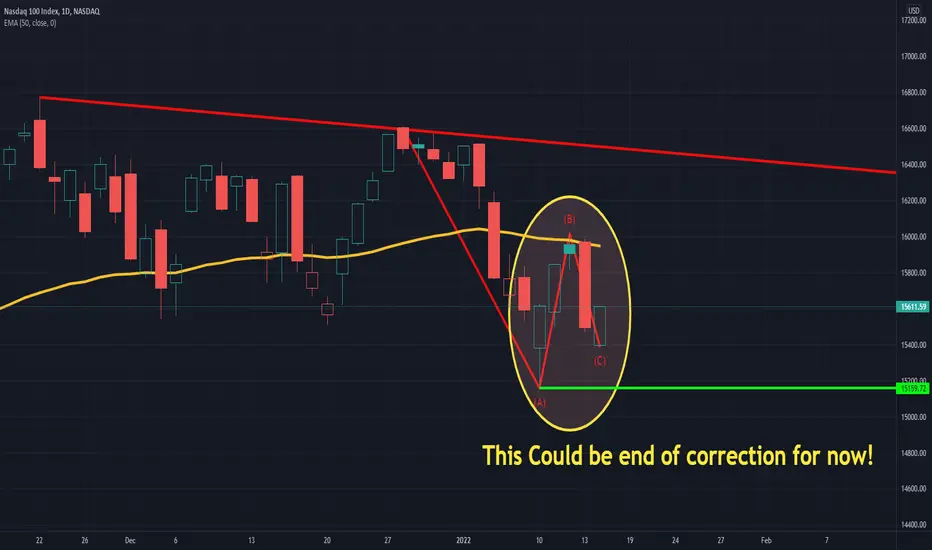
One of the best methods to do analysis on any asset is comparing the current situation with the previous behavior of the same asset!
Having said that,
Let's review the previous 3 corrections:
1-Sep 9th to Nov 12, 2021:

2-April 29 to May 20, 2021:

3- Feb 16 to March 25, 2021

As you can see there are similarities between the current chart pattern and the previous 3 corrections..! which increase the likelihood that we see higher levels for Nasdaq 100 in the coming days(2 weeks)..!
You can see the most important support(green line) and resistance (red line) levels.
Best,
Moshkelgosha
DISCLAIMER
I’m not a certified financial planner/advisor, a certified financial analyst, an economist, a CPA, an accountant, or a lawyer. I’m not a finance professional through formal education. The contents on this site are for informational purposes only and do not constitute financial, accounting, or legal advice. I can’t promise that the information shared on my posts is appropriate for you or anyone else. By using this site, you agree to hold me harmless from any ramifications, financial or otherwise, that occur to you as a result of acting on information found on this site.
Having said that,
Let's review the previous 3 corrections:
1-Sep 9th to Nov 12, 2021:
2-April 29 to May 20, 2021:
3- Feb 16 to March 25, 2021
As you can see there are similarities between the current chart pattern and the previous 3 corrections..! which increase the likelihood that we see higher levels for Nasdaq 100 in the coming days(2 weeks)..!
You can see the most important support(green line) and resistance (red line) levels.
Best,
Moshkelgosha
DISCLAIMER
I’m not a certified financial planner/advisor, a certified financial analyst, an economist, a CPA, an accountant, or a lawyer. I’m not a finance professional through formal education. The contents on this site are for informational purposes only and do not constitute financial, accounting, or legal advice. I can’t promise that the information shared on my posts is appropriate for you or anyone else. By using this site, you agree to hold me harmless from any ramifications, financial or otherwise, that occur to you as a result of acting on information found on this site.

Use the following link to access trading ideas: patreon.com/SniperTraderStocks?utm_medium=unknown&utm_source=join_link&utm_campaign=creatorshare_creator&utm_content=copyLink
免責聲明
這些資訊和出版物並非旨在提供,也不構成TradingView提供或認可的任何形式的財務、投資、交易或其他類型的建議或推薦。請閱讀使用條款以了解更多資訊。
Use the following link to access trading ideas: patreon.com/SniperTraderStocks?utm_medium=unknown&utm_source=join_link&utm_campaign=creatorshare_creator&utm_content=copyLink
免責聲明
這些資訊和出版物並非旨在提供,也不構成TradingView提供或認可的任何形式的財務、投資、交易或其他類型的建議或推薦。請閱讀使用條款以了解更多資訊。