
On Daily:
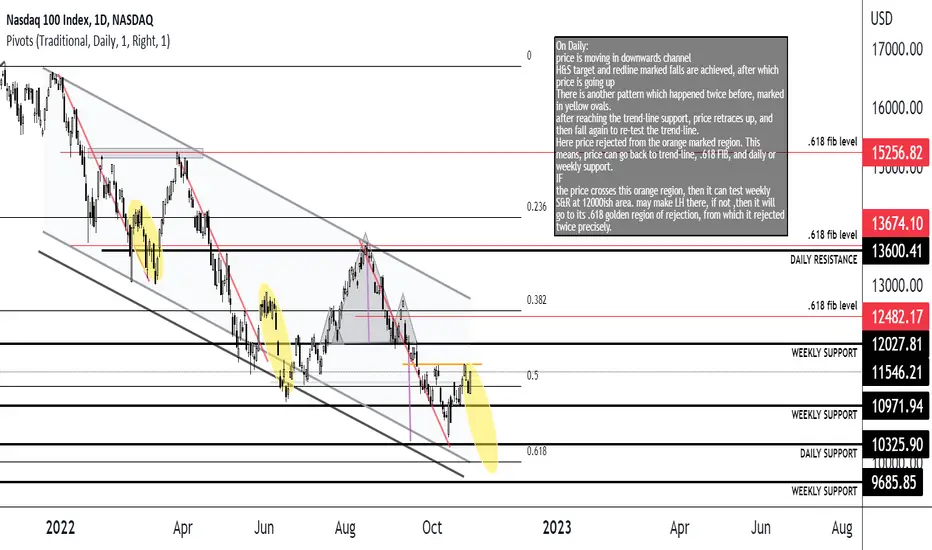
price is moving in downwards channel
H&S target and redline marked falls are achieved, after which price is going up
There is another pattern which happened twice before, marked in yellow ovals.
after reaching the trend-line support, price retraces up, and then fall again to re-test the trend-line.
Here price rejected from the orange marked region. This means, price can go back to trend-line, .618 FIB, and daily or weekly support.
IF
the price crosses this orange region, then it can test weekly S&R at 12000ish area. may make LH there, if not ,then it will go to its .618 golden region of rejection, from which it rejected twice precisely.
price is moving in downwards channel
H&S target and redline marked falls are achieved, after which price is going up
There is another pattern which happened twice before, marked in yellow ovals.
after reaching the trend-line support, price retraces up, and then fall again to re-test the trend-line.
Here price rejected from the orange marked region. This means, price can go back to trend-line, .618 FIB, and daily or weekly support.
IF
the price crosses this orange region, then it can test weekly S&R at 12000ish area. may make LH there, if not ,then it will go to its .618 golden region of rejection, from which it rejected twice precisely.

免責聲明
這些資訊和出版物並非旨在提供,也不構成TradingView提供或認可的任何形式的財務、投資、交易或其他類型的建議或推薦。請閱讀使用條款以了解更多資訊。