
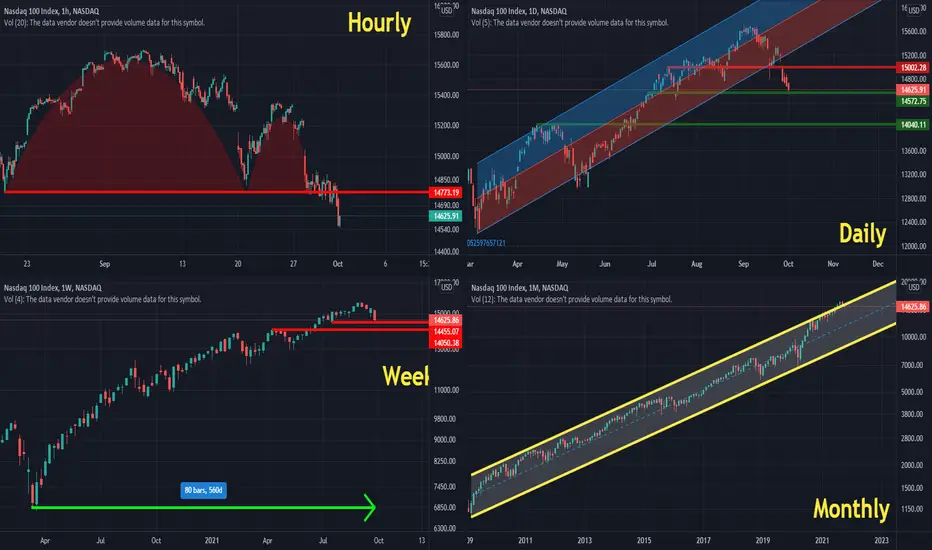
Hourly Chart: Reverse cup and handle pattern (Bearish)
Daily Chart: getting out of Bullish regression Channel and Higher-high higher-low pattern(Bearish)
Weekly Chart: Closing at lower levels for 4 weeks in a row for the first time in the past 80 weeks! (Bearish)
Monthly Chart: September was the Biggest monthly negative candle (-5.73%) in the past 18 months! (Bearish)
Conclusion: I believe this could continue for the next 2-3 weeks and we may find a support level near 14050 level.
Being patient in a market like this will pay off and provide good opportunities, however, you should not forget the best friend you have in the market is your "Stop Loss".
Daily Chart: getting out of Bullish regression Channel and Higher-high higher-low pattern(Bearish)
Weekly Chart: Closing at lower levels for 4 weeks in a row for the first time in the past 80 weeks! (Bearish)
Monthly Chart: September was the Biggest monthly negative candle (-5.73%) in the past 18 months! (Bearish)
Conclusion: I believe this could continue for the next 2-3 weeks and we may find a support level near 14050 level.
Being patient in a market like this will pay off and provide good opportunities, however, you should not forget the best friend you have in the market is your "Stop Loss".

Use the following link to access trading ideas: patreon.com/SniperTraderStocks?utm_medium=unknown&utm_source=join_link&utm_campaign=creatorshare_creator&utm_content=copyLink
免責聲明
這些資訊和出版物並非旨在提供,也不構成TradingView提供或認可的任何形式的財務、投資、交易或其他類型的建議或推薦。請閱讀使用條款以了解更多資訊。
Use the following link to access trading ideas: patreon.com/SniperTraderStocks?utm_medium=unknown&utm_source=join_link&utm_campaign=creatorshare_creator&utm_content=copyLink
免責聲明
這些資訊和出版物並非旨在提供,也不構成TradingView提供或認可的任何形式的財務、投資、交易或其他類型的建議或推薦。請閱讀使用條款以了解更多資訊。