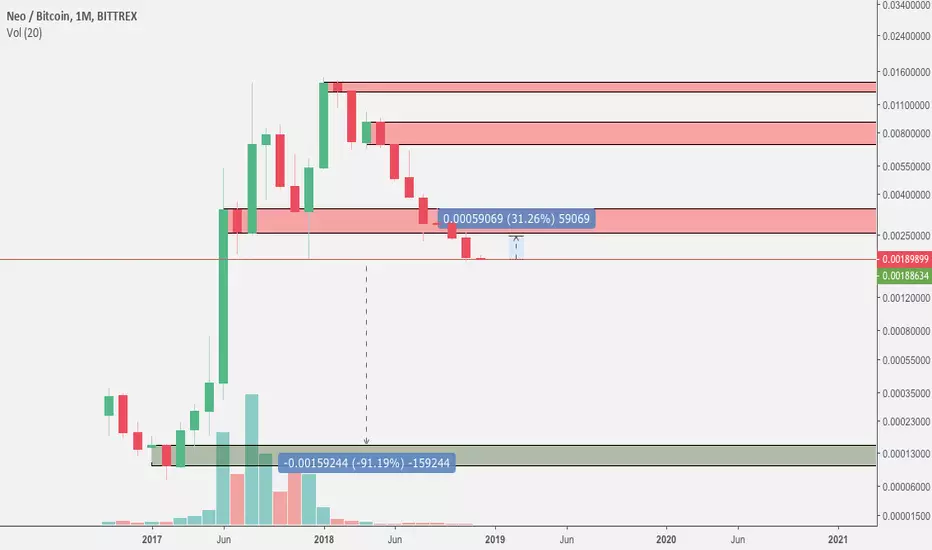
The monthly chart of neobtc looks pretty dangerous, if you're bullish on the NEO project.
Risk averse traders better stay out of NEO at the moment. If you look at weekly/daily levels, you'll see NEO is hanging on the cliff of at least 90% more downwards movements.
However, risk-loving traders might see this as an opportunity. A recovery of NEO might lead to a bounce of 30%. With a tight stop-loss, there are possibilities..
Risk averse traders better stay out of NEO at the moment. If you look at weekly/daily levels, you'll see NEO is hanging on the cliff of at least 90% more downwards movements.
However, risk-loving traders might see this as an opportunity. A recovery of NEO might lead to a bounce of 30%. With a tight stop-loss, there are possibilities..
取消訂單
MISSED A SUPPORT LEVEL. NEW CHART POSTED.
免責聲明
這些資訊和出版物並非旨在提供,也不構成TradingView提供或認可的任何形式的財務、投資、交易或其他類型的建議或推薦。請閱讀使用條款以了解更多資訊。