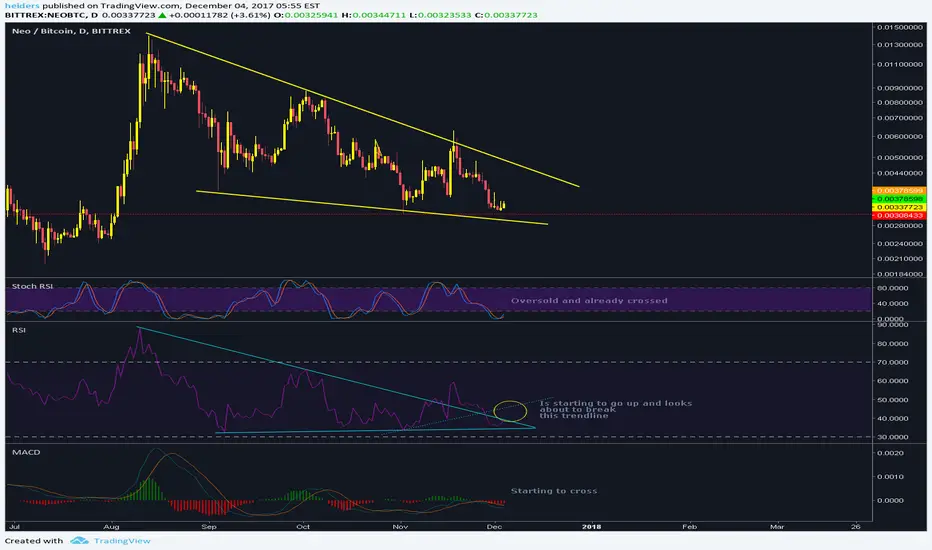
NEO has been in a downtrend since mid August. After a failed swing that could not break the upper trendline and a deep retracement, the indicators again show a positive future for NEO. The Stochastic RSI shows that NEO is oversold on the daily chart has already crossed. Similarly, the RSI is also going up again and seems to be breaking a long term trendline on this chart. It did so as well on the previous swing, but failed to continue at that point and returned in the channel. The MACD seems ready to cross and turn green also. So it looks lik eeverything is lining up again for a nice move up. But NEO is quite fickle and can't always be predicted so easily, so we will have to see. I have added some o my position here and will buy more only after a confirmation of a good move upwards.
交易進行
Worked out very well so far. NEO seems to be in this continuation pattern at the moment, which looks pretty bullish. 
免責聲明
這些資訊和出版物並非旨在提供,也不構成TradingView提供或認可的任何形式的財務、投資、交易或其他類型的建議或推薦。請閱讀使用條款以了解更多資訊。