已更新
Scale in map for NEOUSD
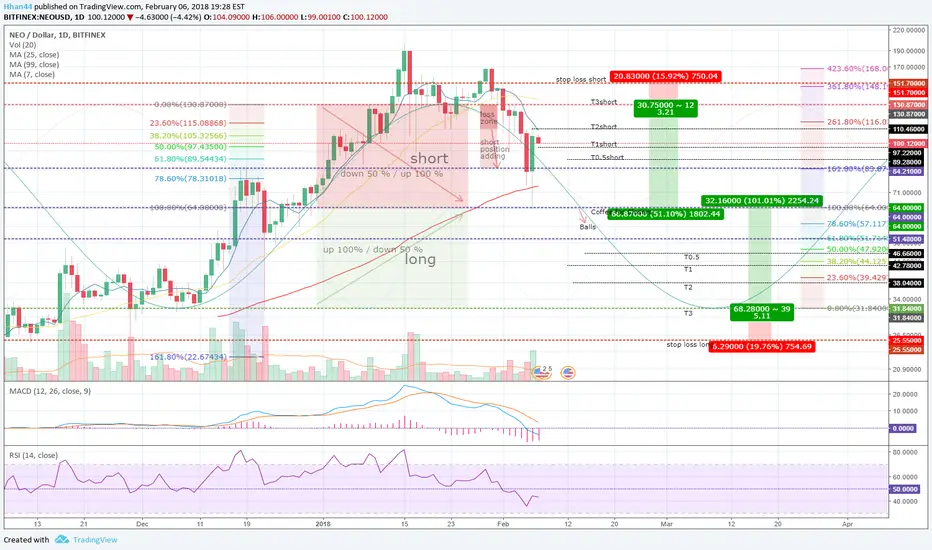
A map to calculate all position sizes to generate a pre-calculated amount of USD output on close day.
註釋
4H chart註釋
Adjusted the short entries. I set them to a bit to pessimistic below the fib levels at first.註釋
I might do a T4 around $27.80 to adjust the stop loss on my personal chart
免責聲明
這些資訊和出版物並非旨在提供,也不構成TradingView提供或認可的任何形式的財務、投資、交易或其他類型的建議或推薦。請閱讀使用條款以了解更多資訊。