
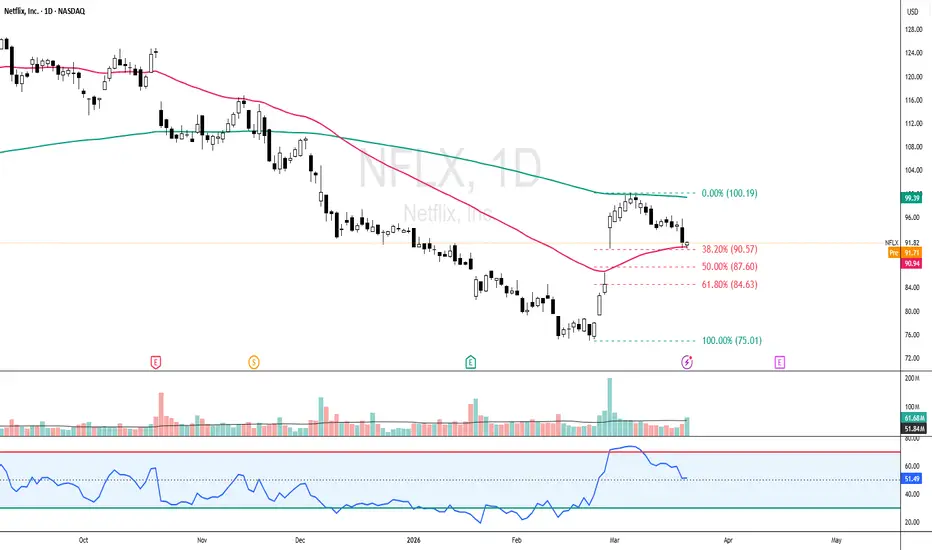
NFLX - CURRENT PRICE : 91.82
Netflix is showing a constructive pullback into a confluence support zone, where price is retracing toward the EMA 50 while simultaneously testing the gap-up demand area. The retracement is also holding near the Fibonacci 38.2% golden ratio, which typically acts as a healthy correction within a developing rebound structure. This combination suggests selling pressure is fading and buyers are stepping in at higher levels, increasing the probability of a continuation move.
Momentum-wise, RSI has cooled from overbought levels and is stabilizing above midline, indicating pullback rather than trend breakdown. As long as price holds above the support cluster, the structure remains bullish for a move higher.
Technical Levels
Buy on weakness / near current zone
Target 1: 99 USD (EMA 200 test) 🎯
Target 2: 108 USD (next resistance zone) 🚀
Support / Invalidation: 86 USD
Risk-Reward: Attractive, with limited downside to 86 vs upside toward 99–108
Overall, the pullback into EMA50 + gap support + 38.2% Fibonacci creates a high-probability technical buy setup, favoring a rebound toward the EMA200 first, followed by a continuation to 108 if momentum builds.
Netflix is showing a constructive pullback into a confluence support zone, where price is retracing toward the EMA 50 while simultaneously testing the gap-up demand area. The retracement is also holding near the Fibonacci 38.2% golden ratio, which typically acts as a healthy correction within a developing rebound structure. This combination suggests selling pressure is fading and buyers are stepping in at higher levels, increasing the probability of a continuation move.
Momentum-wise, RSI has cooled from overbought levels and is stabilizing above midline, indicating pullback rather than trend breakdown. As long as price holds above the support cluster, the structure remains bullish for a move higher.
Technical Levels
Buy on weakness / near current zone
Target 1: 99 USD (EMA 200 test) 🎯
Target 2: 108 USD (next resistance zone) 🚀
Support / Invalidation: 86 USD
Risk-Reward: Attractive, with limited downside to 86 vs upside toward 99–108
Overall, the pullback into EMA50 + gap support + 38.2% Fibonacci creates a high-probability technical buy setup, favoring a rebound toward the EMA200 first, followed by a continuation to 108 if momentum builds.
交易進行
Hit first target at 99 USD on 06 APRIL 2026.交易結束:目標達成
Hit 2nd target at 108 USD on 16 APRIL 2026.
免責聲明
這些資訊和出版物並非旨在提供,也不構成TradingView提供或認可的任何形式的財務、投資、交易或其他類型的建議或推薦。請閱讀使用條款以了解更多資訊。