 NFLX
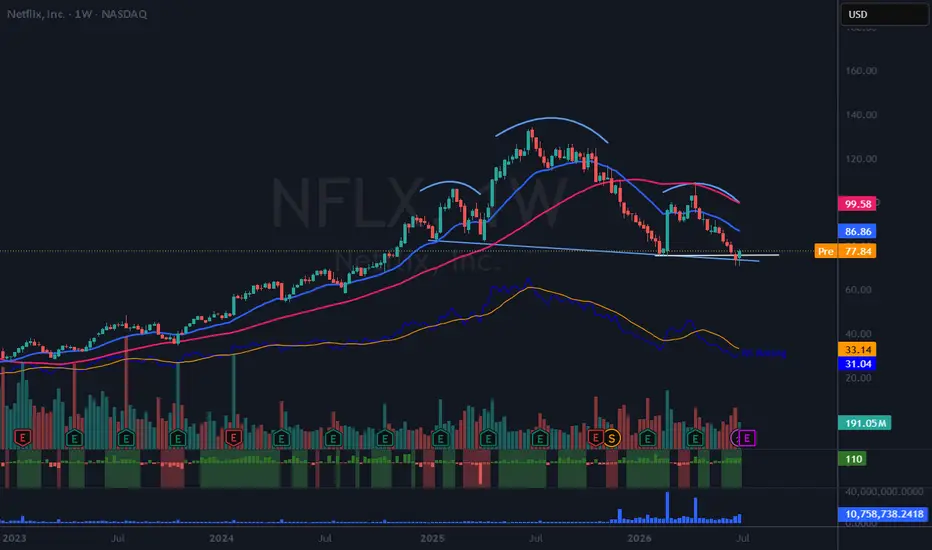
This could be a failed breakdown of a head and shoulders pattern AND an undercut and rally. (White line shows undercut and rally area.) All TBD.
I am back from a much needed 2 week vacation. This one caught my eye. Maybe worth putting on your watchlist.
If I take a position, I'll update this post.
交易進行
This trade has been active since breaking above the neckline. Here are my updated thoughts:NFLX appears to have invalidated the head-and-shoulders pattern I previously noted on the weekly chart above.This 65-minute chart shows Netflix forming a flat base over the past two to three days. It is currently my largest position at 2.5 times my normal size, and I may increase it to 3 times normal if it breaks above the upper horizontal line. I believe it can reclaim its recent highs above $106, though I do not expect a straight move higher. I will use a trailing stop on a decisive close below the 21 EMA.

Ideas I publish are my own. They are not meant to be investment / trading advice. You are encouraged to do your own due diligence.
I am under no obligation to post any action or update to any idea.
Follow me on "X" where I post more content.
I am under no obligation to post any action or update to any idea.
Follow me on "X" where I post more content.
免責聲明
這些資訊和出版物並非旨在提供,也不構成TradingView提供或認可的任何形式的財務、投資、交易或其他類型的建議或推薦。請閱讀使用條款以了解更多資訊。
Ideas I publish are my own. They are not meant to be investment / trading advice. You are encouraged to do your own due diligence.
I am under no obligation to post any action or update to any idea.
Follow me on "X" where I post more content.
I am under no obligation to post any action or update to any idea.
Follow me on "X" where I post more content.
免責聲明
這些資訊和出版物並非旨在提供,也不構成TradingView提供或認可的任何形式的財務、投資、交易或其他類型的建議或推薦。請閱讀使用條款以了解更多資訊。