
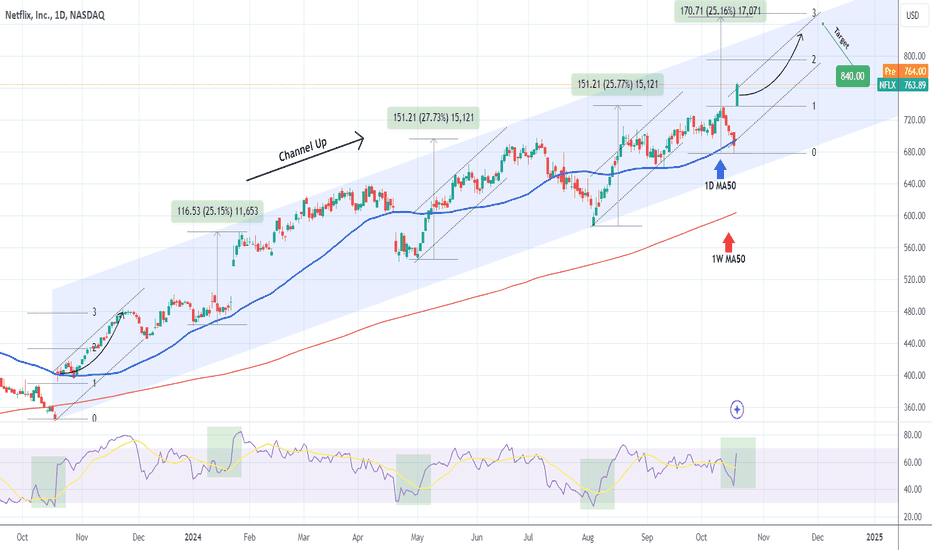
Last time we looked at Netflix (NFLX) was on its earnings release (October 21, see chart below), when we gave a strong bullish signal that easily hit our $840.00 Target:
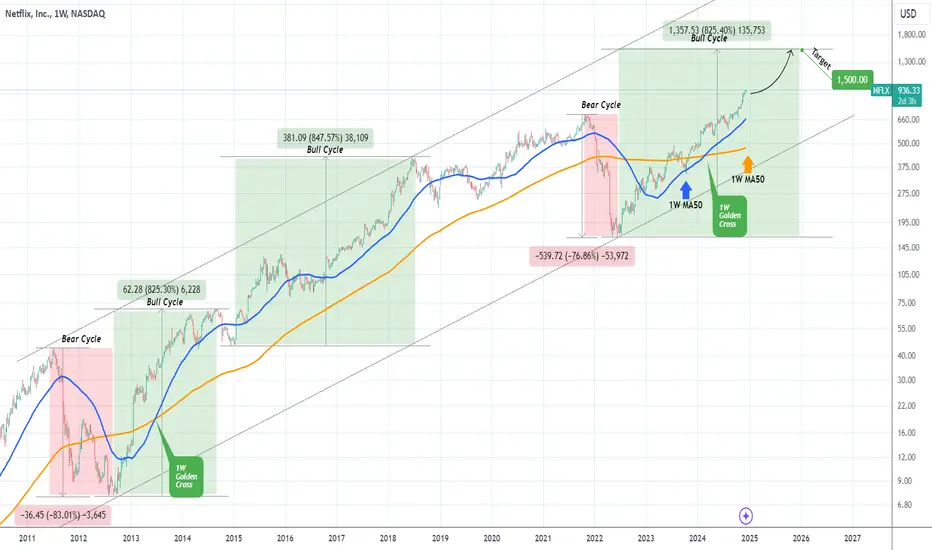
Since 3 week ago, the price even broke above the dominant 1-year Channel Up and is now in search of a new pattern. This pattern can be found if we zoom out considerably on the 1W time-frame, where the underlying pattern since the U.S. Housing Crisis is a 25-year Channel Up.
The symmetry within this pattern is high and in fact since the June 2022 market bottom (which was a Higher Low on the Channel Up), the stock has been on a Bull Cycle. The Bear Cycle that preceded it had a massive decline of -77%. The last correction of this magnitude was the July 2011 - August 2012 Bear Cycle, which declined by -83%.
The two Bull Cycles that followed Netflix's golden years were identical (+825% and +847%). As a result, we assume that the current Bull Cycle will also rise by at least +825% from its bottom, which gives us a $1500 Target towards the end of 2025.
Notice also how both the 2012 - 2014 and 2022 - 2024 Bull Cycles had a 1W Golden Cross.
-------------------------------------------------------------------------------
** Please LIKE 👍, FOLLOW ✅, SHARE 🙌 and COMMENT ✍ if you enjoy this idea! Also share your ideas and charts in the comments section below! This is best way to keep it relevant, support us, keep the content here free and allow the idea to reach as many people as possible. **
-------------------------------------------------------------------------------
💸💸💸💸💸💸
👇 👇 👇 👇 👇 👇
Since 3 week ago, the price even broke above the dominant 1-year Channel Up and is now in search of a new pattern. This pattern can be found if we zoom out considerably on the 1W time-frame, where the underlying pattern since the U.S. Housing Crisis is a 25-year Channel Up.
The symmetry within this pattern is high and in fact since the June 2022 market bottom (which was a Higher Low on the Channel Up), the stock has been on a Bull Cycle. The Bear Cycle that preceded it had a massive decline of -77%. The last correction of this magnitude was the July 2011 - August 2012 Bear Cycle, which declined by -83%.
The two Bull Cycles that followed Netflix's golden years were identical (+825% and +847%). As a result, we assume that the current Bull Cycle will also rise by at least +825% from its bottom, which gives us a $1500 Target towards the end of 2025.
Notice also how both the 2012 - 2014 and 2022 - 2024 Bull Cycles had a 1W Golden Cross.
-------------------------------------------------------------------------------
** Please LIKE 👍, FOLLOW ✅, SHARE 🙌 and COMMENT ✍ if you enjoy this idea! Also share your ideas and charts in the comments section below! This is best way to keep it relevant, support us, keep the content here free and allow the idea to reach as many people as possible. **
-------------------------------------------------------------------------------
💸💸💸💸💸💸
👇 👇 👇 👇 👇 👇

I trade Crypto, Forex, Indices & Commodities on PrimeXBT — all from one account with TradingView charts 👉 tradingshot.short.gy/PrimeXBT
I also use TradeNation for fixed spreads & zero commission 👉 tradingshot.short.gy/Tradenation
I also use TradeNation for fixed spreads & zero commission 👉 tradingshot.short.gy/Tradenation
免責聲明
這些資訊和出版物並非旨在提供,也不構成TradingView提供或認可的任何形式的財務、投資、交易或其他類型的建議或推薦。請閱讀使用條款以了解更多資訊。
I trade Crypto, Forex, Indices & Commodities on PrimeXBT — all from one account with TradingView charts 👉 tradingshot.short.gy/PrimeXBT
I also use TradeNation for fixed spreads & zero commission 👉 tradingshot.short.gy/Tradenation
I also use TradeNation for fixed spreads & zero commission 👉 tradingshot.short.gy/Tradenation
免責聲明
這些資訊和出版物並非旨在提供,也不構成TradingView提供或認可的任何形式的財務、投資、交易或其他類型的建議或推薦。請閱讀使用條款以了解更多資訊。