
Hi Traders,
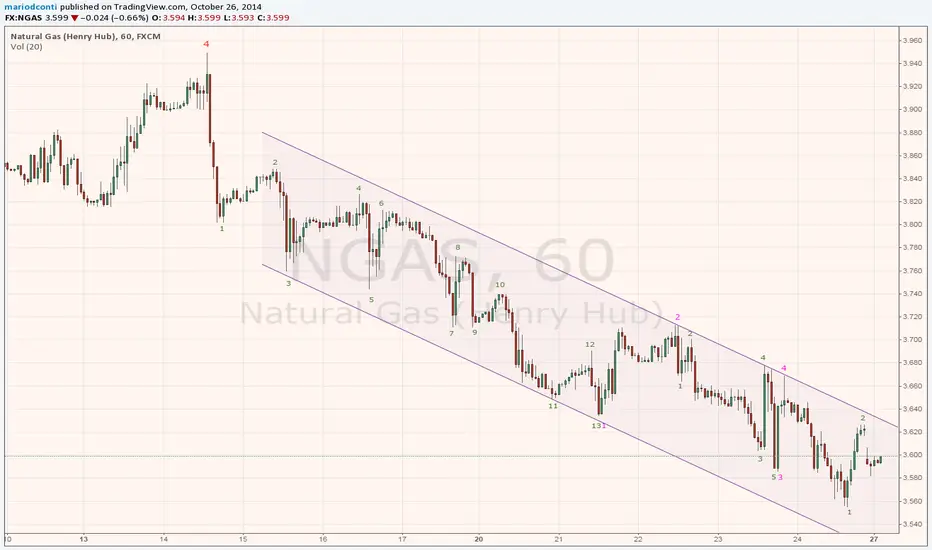
The end of the line of the downtrend of Natural Gas (now at 3601) is very much in sight. This sputtering downtrend is to be followed soon by a significant reversal that would mark the beginning of a major uptrend.
The attached 1-hour chart displays the sub-minuette waves 1 and 2 (in green, bottom right) as part of a group of a 5 waves down that should be completed at the beginning of the week.
At weekly and daily level, this is the very end of a major A-B-C retracement.
TARGETS
first down to the area 3515-3475
then up to the area 4163-4187
Cheers. Mario D. Conti
au.linkedin.com/in/sydneytraders/

免責聲明
這些資訊和出版物並非旨在提供,也不構成TradingView提供或認可的任何形式的財務、投資、交易或其他類型的建議或推薦。請閱讀使用條款以了解更多資訊。
免責聲明
這些資訊和出版物並非旨在提供,也不構成TradingView提供或認可的任何形式的財務、投資、交易或其他類型的建議或推薦。請閱讀使用條款以了解更多資訊。