
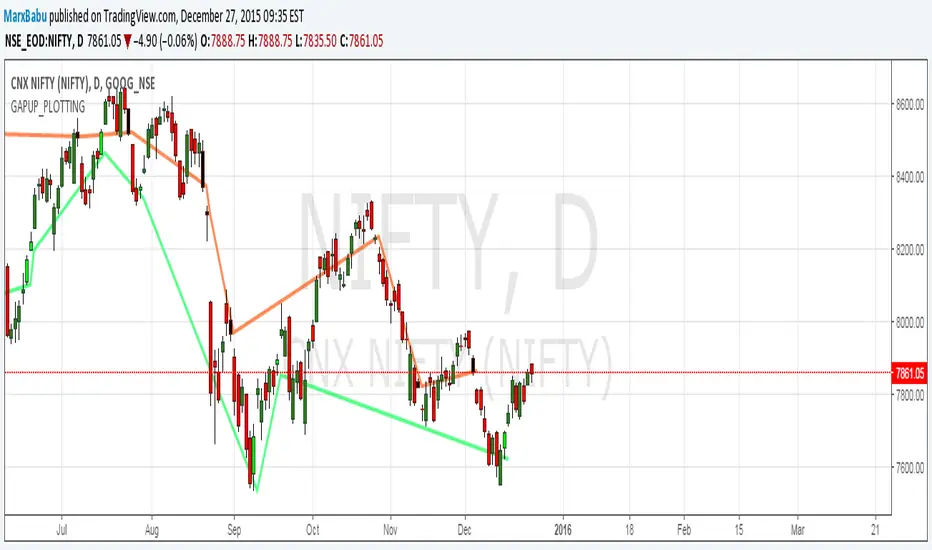
Identify the GAP up and GAP DOWN opening and plot the line.
Strategy when GAPUP identified Buy and target for few 100pips.
1.Color automated Lime candle shows one ahead candle of gapup
2.Black candle shows gapdown.
3.Line drawn for GapUp,GapDown
Strategy when GAPUP identified Buy and target for few 100pips.
1.Color automated Lime candle shows one ahead candle of gapup
2.Black candle shows gapdown.
3.Line drawn for GapUp,GapDown
註釋
The code is available here//version=2
//Author MarxBabu
study(title="GAPUP_PLOTTING", overlay = true)
isUp() => close > open
isDown() => close <= open
//GAP UP DECISION
isGapUp()=> low>low[1] and low>open[1] and low >high[1] and low >close[1] and isUp()
isGapDown()=>high<low[1] and high<open[1] and high< close[1] and high<high[1] and isDown()
x = if isGapUp()
currentLowValue =low[1]
y = if isGapDown()
currentLowValue =close[1]
plot(x, style=line, linewidth=3, color=lime)
plot(y, style=line, linewidth=3, color=red)
barcolor(isGapUp()? #00FF00 :na,-1)
barcolor(isGapDown() ? #030303 :na,-1)

🌳Indicator:bit.ly/2DJVXDn 💚
🦄telegram:t.me/longbuylongsellindicator 🟢
✔️contact:t.me/wealthworldmajic
🎯web:marxcbabu.blogspot.com/
🟠twitter:twitter.com/marxcbabu 💲
youtube.com/@marxcbabu/videos
🦄telegram:t.me/longbuylongsellindicator 🟢
✔️contact:t.me/wealthworldmajic
🎯web:marxcbabu.blogspot.com/
🟠twitter:twitter.com/marxcbabu 💲
youtube.com/@marxcbabu/videos
免責聲明
這些資訊和出版物並非旨在提供,也不構成TradingView提供或認可的任何形式的財務、投資、交易或其他類型的建議或推薦。請閱讀使用條款以了解更多資訊。
🌳Indicator:bit.ly/2DJVXDn 💚
🦄telegram:t.me/longbuylongsellindicator 🟢
✔️contact:t.me/wealthworldmajic
🎯web:marxcbabu.blogspot.com/
🟠twitter:twitter.com/marxcbabu 💲
youtube.com/@marxcbabu/videos
🦄telegram:t.me/longbuylongsellindicator 🟢
✔️contact:t.me/wealthworldmajic
🎯web:marxcbabu.blogspot.com/
🟠twitter:twitter.com/marxcbabu 💲
youtube.com/@marxcbabu/videos
免責聲明
這些資訊和出版物並非旨在提供,也不構成TradingView提供或認可的任何形式的財務、投資、交易或其他類型的建議或推薦。請閱讀使用條款以了解更多資訊。