
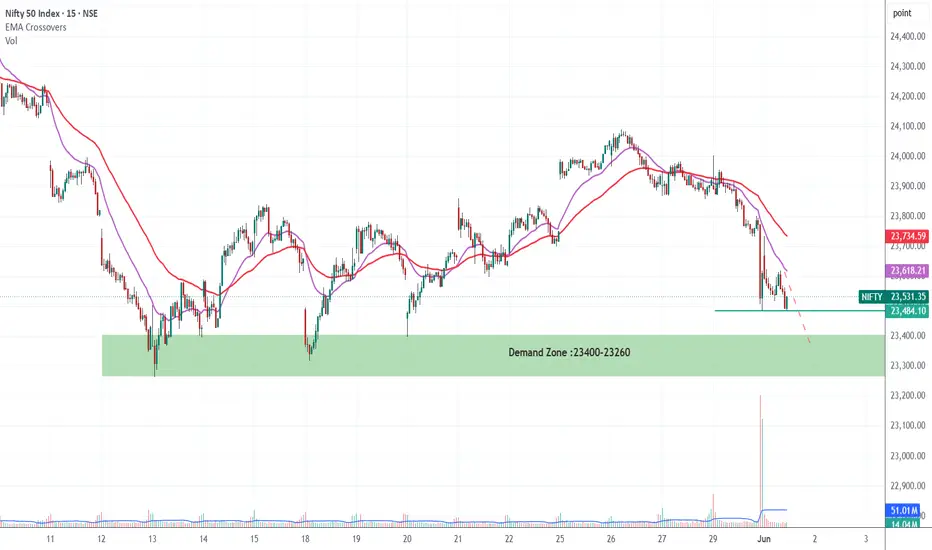
NIFTY is showing weakness on the 15-minute chart, hourly chart even daily chart as price continues trading below both EMAs, indicating bearish momentum. A sharp breakdown with strong volume confirms seller dominance, while the 23400–23260 demand zone is now the key area to watch. If buyers defend this zone, a short-term bounce is possible, but a breakdown below it may trigger further downside pressure.
交易進行
Now Nifty Entered into Demand Zone, it may remain Sidways for sometime交易結束:目標達成

免責聲明
這些資訊和出版物並非旨在提供,也不構成TradingView提供或認可的任何形式的財務、投資、交易或其他類型的建議或推薦。請閱讀使用條款以了解更多資訊。