
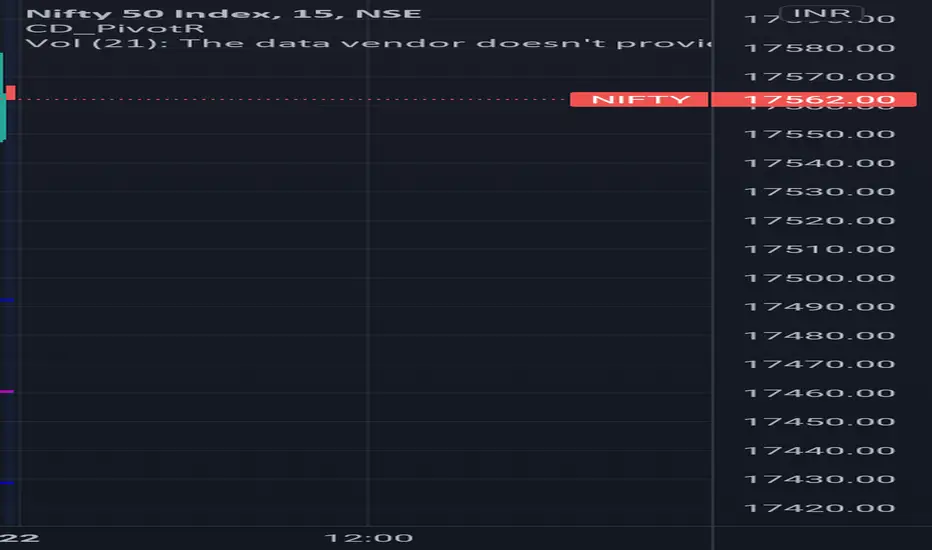
Nifty formed an green hammer
(Which is telling that there was selling pressure during the day ultimately a strong buying pressure drove the prices . This is what happened today)
And if we see the intraday volatility today is about 0.72% which is good volatility range
Positive sign :- closed above intraday pivot control point of 17500 level which is 1st resistance level for Nifty today
I give an caution for option sellers (u can see in mine profile)
ie. CALL shorts will get covered if breakout of 17500-17530 levels
If go and see the option chain data (Given link below ) u can more shorts get covered in between strikes of 17500 to 17800 .
Let's watch out intraday levels for Nifty for 22 SEP
🎯 Key levels
Buying CALL only above 17620-17650 level which very crucial resistance zone
And Buying PUT option only when traded below the 17330-17300 level which is very crucial support zone [for option buyers]
And Nifty will become when it's Traded below the 17450 level which is control pivot point region and don't short market until breakdown down this level [call writers] otherwise u will run for covering
(Which is telling that there was selling pressure during the day ultimately a strong buying pressure drove the prices . This is what happened today)
And if we see the intraday volatility today is about 0.72% which is good volatility range
Positive sign :- closed above intraday pivot control point of 17500 level which is 1st resistance level for Nifty today
I give an caution for option sellers (u can see in mine profile)
ie. CALL shorts will get covered if breakout of 17500-17530 levels
If go and see the option chain data (Given link below ) u can more shorts get covered in between strikes of 17500 to 17800 .
Let's watch out intraday levels for Nifty for 22 SEP
🎯 Key levels
Buying CALL only above 17620-17650 level which very crucial resistance zone
And Buying PUT option only when traded below the 17330-17300 level which is very crucial support zone [for option buyers]
And Nifty will become when it's Traded below the 17450 level which is control pivot point region and don't short market until breakdown down this level [call writers] otherwise u will run for covering

免責聲明
這些資訊和出版物並非旨在提供,也不構成TradingView提供或認可的任何形式的財務、投資、交易或其他類型的建議或推薦。請閱讀使用條款以了解更多資訊。
免責聲明
這些資訊和出版物並非旨在提供,也不構成TradingView提供或認可的任何形式的財務、投資、交易或其他類型的建議或推薦。請閱讀使用條款以了解更多資訊。