
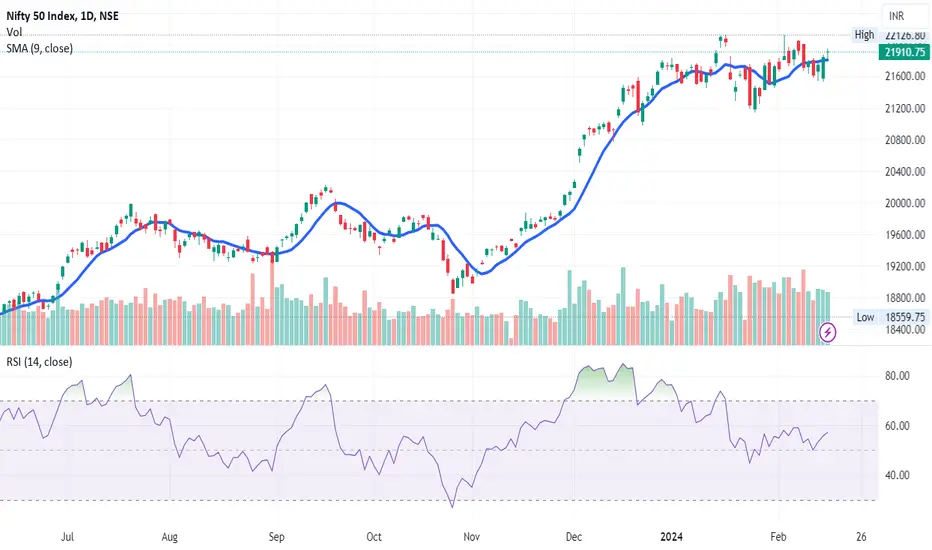
The Nifty traded in a narrow range throughout the day and formed Doji candle on the daily chart.
Which is indicating indecisiveness amongst the participants.
Candle is closed above 9 days Simple Moving Average Line.
We may see resistance at 22115 level and support at 21748 level.
⚠️ Important: Always maintain your Risk & Reward Ratio.
✅Like and follow to never miss a new idea!✅
Disclaimer: I am not SEBI Registered Advisor. My posts are purely for training and educational purposes.
Eat🍜 Sleep😴 TradingView📈 Repeat 🔁
Happy learning with trading. Cheers!🥂
Which is indicating indecisiveness amongst the participants.
Candle is closed above 9 days Simple Moving Average Line.
We may see resistance at 22115 level and support at 21748 level.
⚠️ Important: Always maintain your Risk & Reward Ratio.
✅Like and follow to never miss a new idea!✅
Disclaimer: I am not SEBI Registered Advisor. My posts are purely for training and educational purposes.
Eat🍜 Sleep😴 TradingView📈 Repeat 🔁
Happy learning with trading. Cheers!🥂

免責聲明
這些資訊和出版物並非旨在提供,也不構成TradingView提供或認可的任何形式的財務、投資、交易或其他類型的建議或推薦。請閱讀使用條款以了解更多資訊。