
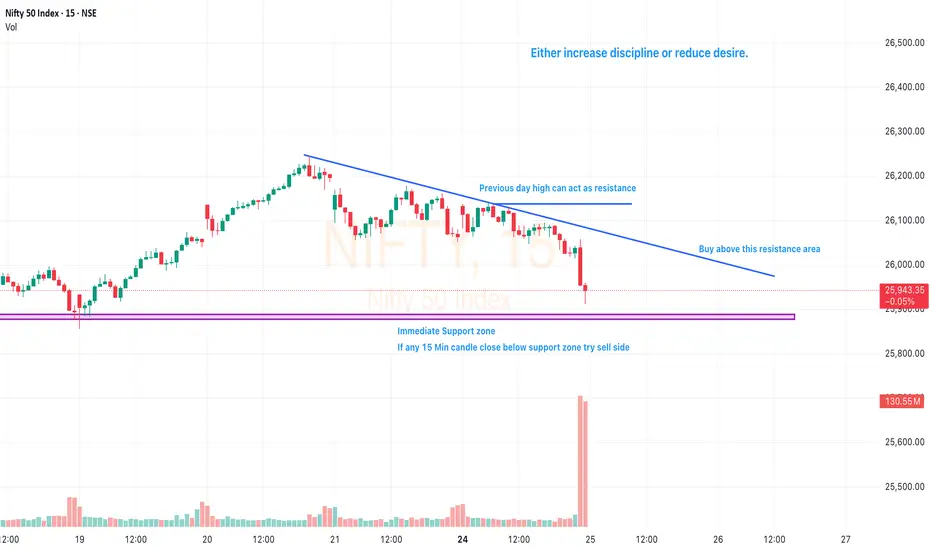
Nifty 15-min Chart Outlook
1) Price is moving inside a short-term downtrend, respecting a descending trendline.
2) Previous day high is marked and may act as a strong resistance. A close above trendline breakout can trigger a bullish move target previous day high.
3) Until the resistance zone is taken out, the bias remains bearish on rallies.
4) Immediate support zone highlighted. A clean 15-min candle close below this support can open the door for further downside.
5) Watch for volume confirmation on breakout/breakdown to avoid false moves.
Trading Plan:
Buy above Trendline target previous day high resistance area. (Or can buy near support zone risky trade but risk and reward will be good)
Sell below: Immediate support zone on a strong 15-min close.
Structure currently favours sell-on-rise unless the trendline breaks.
1) Price is moving inside a short-term downtrend, respecting a descending trendline.
2) Previous day high is marked and may act as a strong resistance. A close above trendline breakout can trigger a bullish move target previous day high.
3) Until the resistance zone is taken out, the bias remains bearish on rallies.
4) Immediate support zone highlighted. A clean 15-min candle close below this support can open the door for further downside.
5) Watch for volume confirmation on breakout/breakdown to avoid false moves.
Trading Plan:
Buy above Trendline target previous day high resistance area. (Or can buy near support zone risky trade but risk and reward will be good)
Sell below: Immediate support zone on a strong 15-min close.
Structure currently favours sell-on-rise unless the trendline breaks.
註釋
Day 2 of 30 trades.#Nifty

免責聲明
這些資訊和出版物並非旨在提供,也不構成TradingView提供或認可的任何形式的財務、投資、交易或其他類型的建議或推薦。請閱讀使用條款以了解更多資訊。