
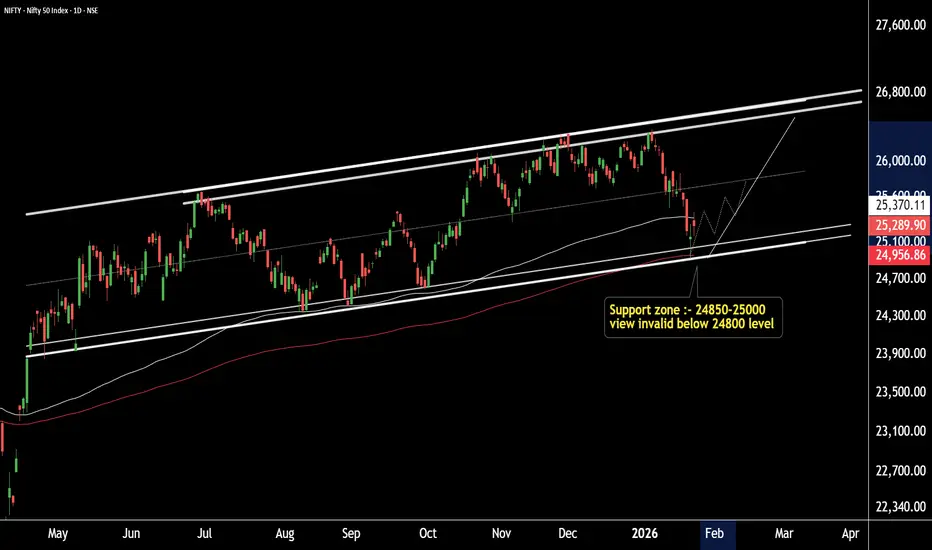
This is the daily timeframe chart of NIFTY.
NIFTY is showing strong support in the 24,850–24,950 zone. This zone is technically important due to multiple confirmations:
EMA support near 24,956
Fibonacci support near 24,938
Additionally, the channel support lies in the 24,850–25,050 range, strengthening the overall support structure.
On the upside, immediate resistance is seen around 25,500–25,700, while the next major resistance is placed near 26,400–26,500.
If this support zone holds, NIFTY is well-positioned for the next bullish move towards the mentioned resistance levels.
view invalid below 24800.
Thank you.
NIFTY is showing strong support in the 24,850–24,950 zone. This zone is technically important due to multiple confirmations:
EMA support near 24,956
Fibonacci support near 24,938
Additionally, the channel support lies in the 24,850–25,050 range, strengthening the overall support structure.
On the upside, immediate resistance is seen around 25,500–25,700, while the next major resistance is placed near 26,400–26,500.
If this support zone holds, NIFTY is well-positioned for the next bullish move towards the mentioned resistance levels.
view invalid below 24800.
Thank you.

@RahulSarawagi
Connect us at optionlab.co.in/
Connect us at optionlab.co.in/
免責聲明
這些資訊和出版物並非旨在提供,也不構成TradingView提供或認可的任何形式的財務、投資、交易或其他類型的建議或推薦。請閱讀使用條款以了解更多資訊。
@RahulSarawagi
Connect us at optionlab.co.in/
Connect us at optionlab.co.in/
免責聲明
這些資訊和出版物並非旨在提供,也不構成TradingView提供或認可的任何形式的財務、投資、交易或其他類型的建議或推薦。請閱讀使用條款以了解更多資訊。