
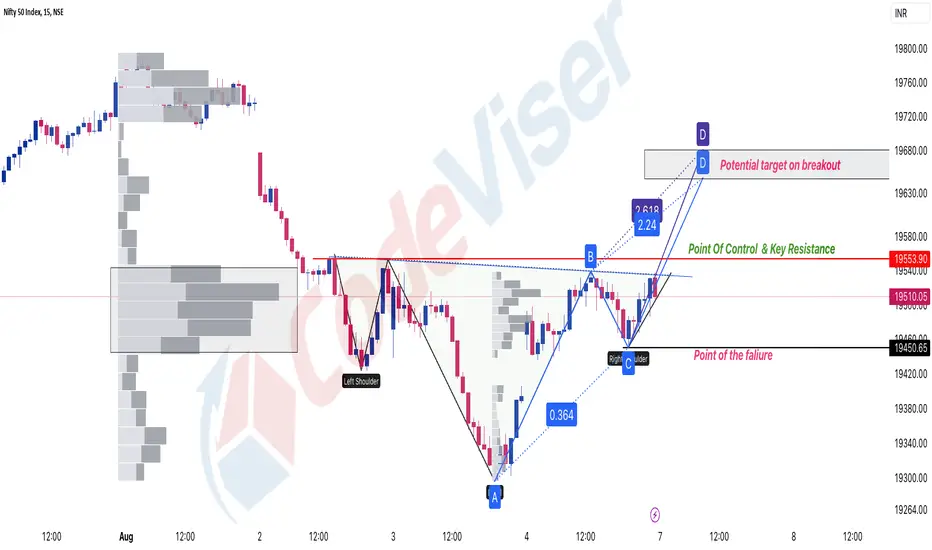
I've used charts to show things clearly. On Monday, there are two critical levels to watch. The first is 19,560 – a critical resistance point because the Index has been stopped by it many times before. If the Index breaks past this point, it might show a new trend (a change in how prices move). The second level is the low point, which might mean the prices will continue decreasing. If prices are between these two levels, it's not a good time to trade. I've also pointed out possible goals if the resistance level is crossed.
So, when you trade, remember these things.
So, when you trade, remember these things.

Telegram: t.me/Virendrapandey81
Website: vpcapitalresearch.com
Follow us on Twitter: twitter.com/Virupandey81
YouTube: youtube.com/@codeviser
Website: vpcapitalresearch.com
Follow us on Twitter: twitter.com/Virupandey81
YouTube: youtube.com/@codeviser
免責聲明
這些資訊和出版物並非旨在提供,也不構成TradingView提供或認可的任何形式的財務、投資、交易或其他類型的建議或推薦。請閱讀使用條款以了解更多資訊。
Telegram: t.me/Virendrapandey81
Website: vpcapitalresearch.com
Follow us on Twitter: twitter.com/Virupandey81
YouTube: youtube.com/@codeviser
Website: vpcapitalresearch.com
Follow us on Twitter: twitter.com/Virupandey81
YouTube: youtube.com/@codeviser
免責聲明
這些資訊和出版物並非旨在提供,也不構成TradingView提供或認可的任何形式的財務、投資、交易或其他類型的建議或推薦。請閱讀使用條款以了解更多資訊。