
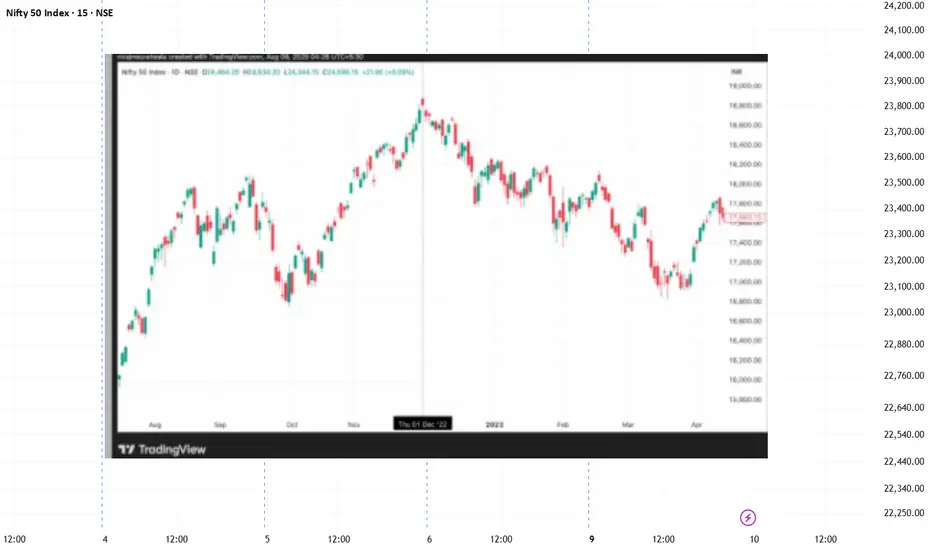
This idea shares a historical, educational study of how time-based market structure can be analyzed using principles derived from WD Gann methodology.
⚠️ This is not a forecast or trade call.
It is a post-event structural study for learning purposes only.
📌 Study Context
📊 What the Chart Demonstrates
🧠 Key Learning Points
⚠️ Disclaimer
This content is shared strictly for educational and research purposes.
It does not constitute investment advice, recommendations, or forecasts.
⚠️ This is not a forecast or trade call.
It is a post-event structural study for learning purposes only.
📌 Study Context
- During October 2022, NIFTY was in a corrective phase with strong bearish sentiment.
- Instead of focusing on momentum or news, this study highlights how time exhaustion and structural balance can be observed on the chart.
📊 What the Chart Demonstrates
- A time zone where selling pressure began to lose effectiveness
- Price behavior shifting from impulse decline to consolidation
- How markets often pause or reverse when time symmetry completes
- A subsequent time window where expansion stalled again
- This study focuses on how time influences structure, not on predicting future market movement.
🧠 Key Learning Points
- Markets often change behavior after time completion, not price extremes
- Time-based analysis helps identify risk zones, not certainty
- WD Gann methods emphasize structure and balance, not directional bias
- Studying past cycles improves contextual understanding
⚠️ Disclaimer
This content is shared strictly for educational and research purposes.
It does not constitute investment advice, recommendations, or forecasts.

相關出版品
免責聲明
這些資訊和出版物並非旨在提供,也不構成TradingView提供或認可的任何形式的財務、投資、交易或其他類型的建議或推薦。請閱讀使用條款以了解更多資訊。