
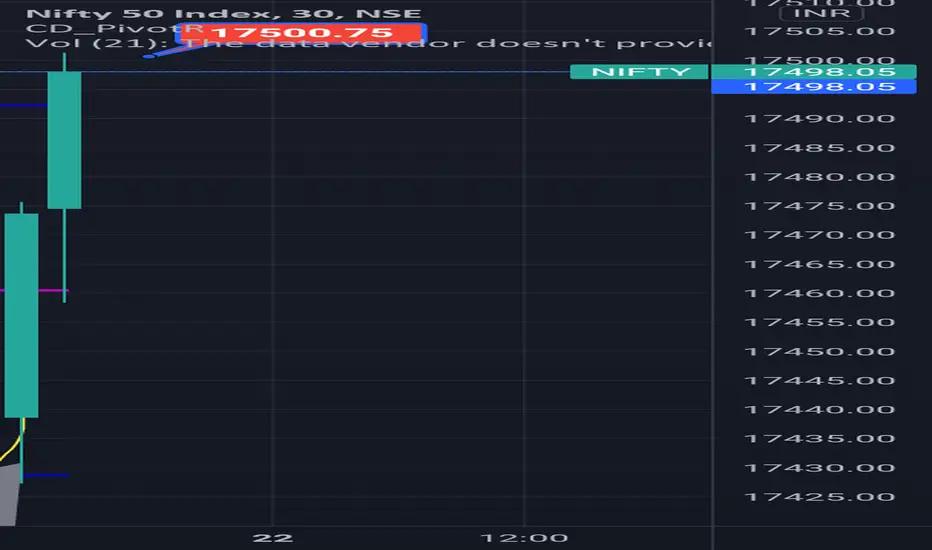
Can you guys see which patter Nifty is formed now .... If you see in 5 mins chart you can see clear picture of it .
Nifty as bounce back from support level of 17330-17300 it's support level of past 5th pivot point region which is imp support level and formed inverse head and shoulders with taking resistance of level 17430 lower end of today pivot point which acting as an strong resistance now and Take an trade BUY CALL Nifty when it breakout of resistance 17500-17510 with low quantity because there's more volatility in market ...
Nifty as bounce back from support level of 17330-17300 it's support level of past 5th pivot point region which is imp support level and formed inverse head and shoulders with taking resistance of level 17430 lower end of today pivot point which acting as an strong resistance now and Take an trade BUY CALL Nifty when it breakout of resistance 17500-17510 with low quantity because there's more volatility in market ...

免責聲明
這些資訊和出版物並非旨在提供,也不構成TradingView提供或認可的任何形式的財務、投資、交易或其他類型的建議或推薦。請閱讀使用條款以了解更多資訊。
免責聲明
這些資訊和出版物並非旨在提供,也不構成TradingView提供或認可的任何形式的財務、投資、交易或其他類型的建議或推薦。請閱讀使用條款以了解更多資訊。