
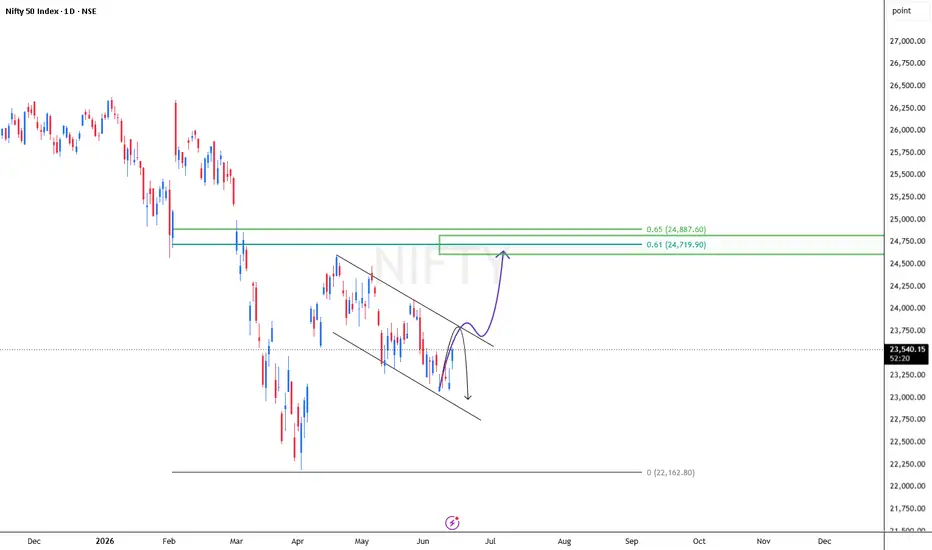
NIFTY Daily Chart Outlook
NIFTY is currently trading within a falling channel and approaching a key trendline resistance.
📈 Bullish Scenario
If NIFTY breaks above the descending trendline with strong momentum and sustains the breakout, it could trigger a move towards the 24,750 resistance zone.
This area also aligns with the 0.61–0.65 Fibonacci retracement zone, making it an important upside target.
📉 Bearish Scenario
If the index fails to break the trendline and faces rejection from current levels, selling pressure may resume.
In that case, NIFTY could revisit the 23,000 support zone.
🎯 Key Levels
Breakout Confirmation: Descending trendline resistance
Upside Target: 24,750
Downside Support: 23,000
Summary: A breakout above the falling channel could open the door for a rally towards 24,750, while rejection from the trendline may lead to another decline towards the 23,000 support area.
NIFTY is currently trading within a falling channel and approaching a key trendline resistance.
📈 Bullish Scenario
If NIFTY breaks above the descending trendline with strong momentum and sustains the breakout, it could trigger a move towards the 24,750 resistance zone.
This area also aligns with the 0.61–0.65 Fibonacci retracement zone, making it an important upside target.
📉 Bearish Scenario
If the index fails to break the trendline and faces rejection from current levels, selling pressure may resume.
In that case, NIFTY could revisit the 23,000 support zone.
🎯 Key Levels
Breakout Confirmation: Descending trendline resistance
Upside Target: 24,750
Downside Support: 23,000
Summary: A breakout above the falling channel could open the door for a rally towards 24,750, while rejection from the trendline may lead to another decline towards the 23,000 support area.

免責聲明
這些資訊和出版物並非旨在提供,也不構成TradingView提供或認可的任何形式的財務、投資、交易或其他類型的建議或推薦。請閱讀使用條款以了解更多資訊。
免責聲明
這些資訊和出版物並非旨在提供,也不構成TradingView提供或認可的任何形式的財務、投資、交易或其他類型的建議或推薦。請閱讀使用條款以了解更多資訊。