
Overall Market Structure
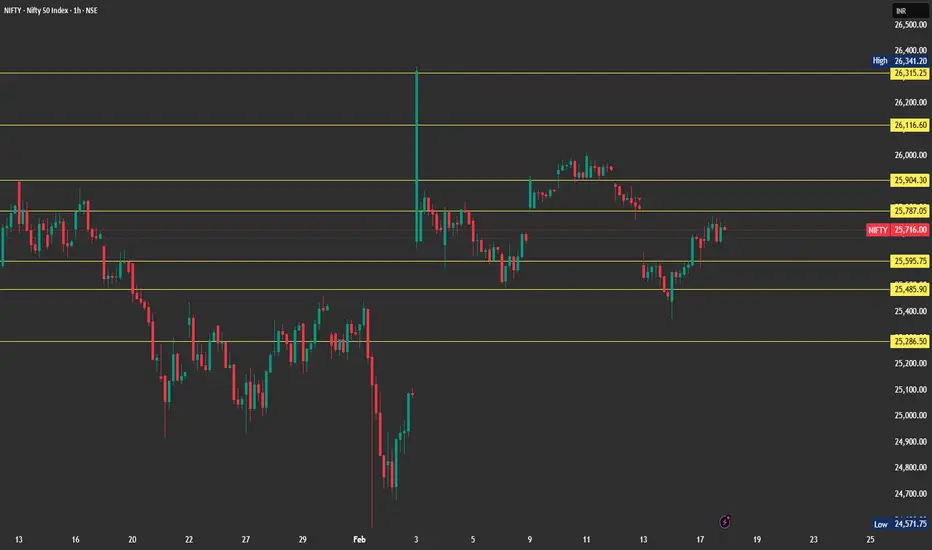
Nifty earlier declined sharply and formed a low near 24,700–24,800, showing panic selling.
From this zone, the index bounced strongly, indicating short-term bottom formation.
After the recovery, price moved into a sideways-to-corrective phase, showing indecision.
Currently, the trend is range-bound with mild bearish pressure.
Key Levels from the Chart
Major Resistance Zones:
26,315 – 26,340 – Strong supply and recent high
26,116 – Important upper resistance
25,904 – Intermediate resistance
Immediate Resistance:
25,787 – Near-term hurdle
Support Zones:
25,596 – Immediate support
25,486 – Strong short-term support
25,286 – Major demand zone
24,700 – 24,800 – Long-term base
Price Action Analysis
The sharp green candle near early February shows aggressive short covering and fresh buying.
After touching the 26,000 zone, price failed to sustain and faced profit booking.
Lower highs after 26,000 indicate weakening momentum.
Recent bounce from 25,480 shows buyers are still active, but strength is limited.
Trading Insight (Educational Purpose)
Below 25,900, bias remains cautious to bearish.
If price fails near 25,780–25,800, selling pressure may return.
A breakdown below 25,480 can lead to 25,300 → 24,900.
A bullish trend will resume only if price sustains above 26,100.
Nifty earlier declined sharply and formed a low near 24,700–24,800, showing panic selling.
From this zone, the index bounced strongly, indicating short-term bottom formation.
After the recovery, price moved into a sideways-to-corrective phase, showing indecision.
Currently, the trend is range-bound with mild bearish pressure.
Key Levels from the Chart
Major Resistance Zones:
26,315 – 26,340 – Strong supply and recent high
26,116 – Important upper resistance
25,904 – Intermediate resistance
Immediate Resistance:
25,787 – Near-term hurdle
Support Zones:
25,596 – Immediate support
25,486 – Strong short-term support
25,286 – Major demand zone
24,700 – 24,800 – Long-term base
Price Action Analysis
The sharp green candle near early February shows aggressive short covering and fresh buying.
After touching the 26,000 zone, price failed to sustain and faced profit booking.
Lower highs after 26,000 indicate weakening momentum.
Recent bounce from 25,480 shows buyers are still active, but strength is limited.
Trading Insight (Educational Purpose)
Below 25,900, bias remains cautious to bearish.
If price fails near 25,780–25,800, selling pressure may return.
A breakdown below 25,480 can lead to 25,300 → 24,900.
A bullish trend will resume only if price sustains above 26,100.

免責聲明
這些資訊和出版物並非旨在提供,也不構成TradingView提供或認可的任何形式的財務、投資、交易或其他類型的建議或推薦。請閱讀使用條款以了解更多資訊。
免責聲明
這些資訊和出版物並非旨在提供,也不構成TradingView提供或認可的任何形式的財務、投資、交易或其他類型的建議或推薦。請閱讀使用條款以了解更多資訊。