
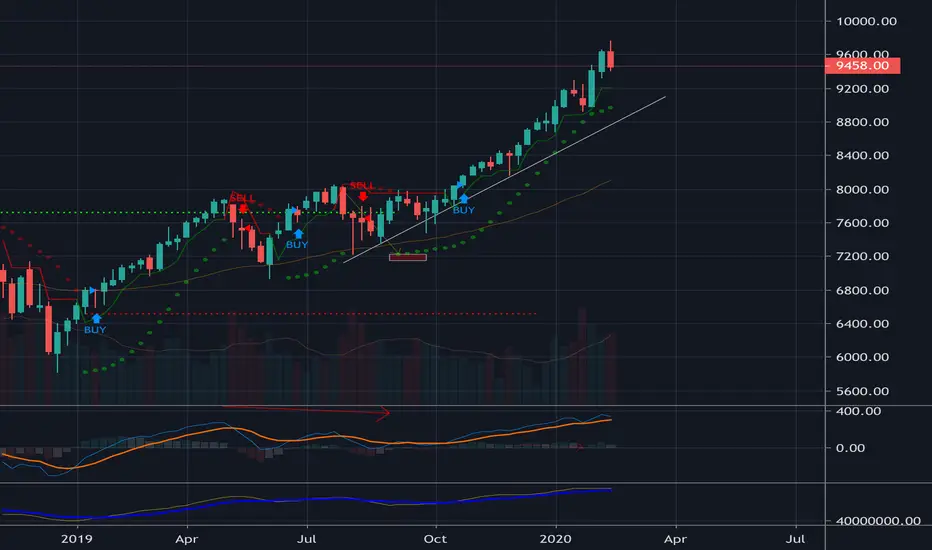
Have you seen it?
It’s on the weekly chart, and all we need is the coming week to be down for a bearish reversal confirmation pattern to complete the DARK CLOUD COVER
Technicals not yet supportive of a bearish trend YET, understandably as candlesticks are the first price indicator to give the heads up. Bearing in mind (pun not intended), that the recent rallies to historical highs are led by technology sector / NASDAQ, this is a leader to watch for the imminent danger.
IF projections are correct, this one can move -15% from current levels to about 8000!!!
So Heads Up!
It’s on the weekly chart, and all we need is the coming week to be down for a bearish reversal confirmation pattern to complete the DARK CLOUD COVER
Technicals not yet supportive of a bearish trend YET, understandably as candlesticks are the first price indicator to give the heads up. Bearing in mind (pun not intended), that the recent rallies to historical highs are led by technology sector / NASDAQ, this is a leader to watch for the imminent danger.
IF projections are correct, this one can move -15% from current levels to about 8000!!!
So Heads Up!

免責聲明
這些資訊和出版物並非旨在提供,也不構成TradingView提供或認可的任何形式的財務、投資、交易或其他類型的建議或推薦。請閱讀使用條款以了解更多資訊。