
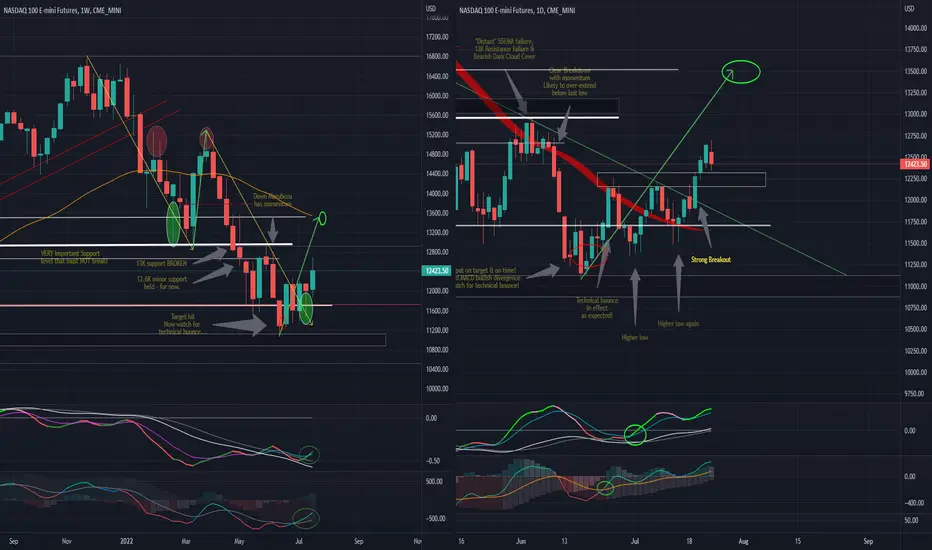
Ok, so we got the NASDAQ bounce for the week as outlined in the previous post. How now, brown cow?
The weekly chart now has bullish crossovers in the technical indicators, and clearly a breakout of the consolidation range between 11,200 to 12,200. Mildly and cautiously bullish for the weekly chart,
The daily chart shows that the week ended lower after clocking an intraday high that is also the week's high. The candlestick is actually bearish, and the daily technicals appear a bit winded. This collectively may result in an early to mid week retracement, and then a possible uptick.
Note that the FOMC meeting is on 26-27 July, so aligned that the early week would be jittery and later in the week sees a stronger move.
Either way, be like water, my friends...
The weekly chart now has bullish crossovers in the technical indicators, and clearly a breakout of the consolidation range between 11,200 to 12,200. Mildly and cautiously bullish for the weekly chart,
The daily chart shows that the week ended lower after clocking an intraday high that is also the week's high. The candlestick is actually bearish, and the daily technicals appear a bit winded. This collectively may result in an early to mid week retracement, and then a possible uptick.
Note that the FOMC meeting is on 26-27 July, so aligned that the early week would be jittery and later in the week sees a stronger move.
Either way, be like water, my friends...

免責聲明
這些資訊和出版物並非旨在提供,也不構成TradingView提供或認可的任何形式的財務、投資、交易或其他類型的建議或推薦。請閱讀使用條款以了解更多資訊。