Institutional-Grade Mean Reversion Setup on $NSC.
My proprietary scanner flagged Norfolk Southern ( NSC) today as a high-probability reversal candidate based on volatility metrics.
The Technical Confluence:
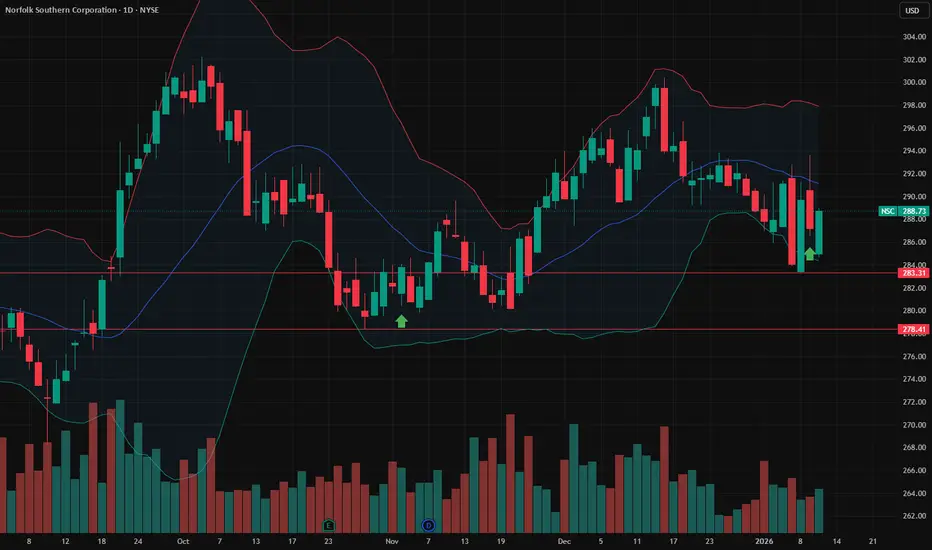
Volatility Extension: Price pierced the Lower Bollinger Band (2.0 StdDev), indicating an overextended move to the downside.
Momentum Reset: RSI is strictly oversold and hooking up, signaling stabilizing momentum.
Algo Confirmation: My custom quantitative model triggered a mechanical entry signal (Green Arrow), validating that internal volume metrics support a bounce.
Structural Support: We identified a volatility floor around the $278 - $280 level (see red line on chart).
The Strategy (Income): Instead of buying the dip aggressively, we utilize the high Implied Volatility to sell Puts at or below the structural support level. This generates theta (time decay) profit even if the stock consolidates.
Thesis: Theta Decay + Mean Reversion.
Disclaimer: Educational analysis only. Not financial advice.
My proprietary scanner flagged Norfolk Southern (
NSC) today as a high-probability reversal candidate based on volatility metrics.The Technical Confluence:
Volatility Extension: Price pierced the Lower Bollinger Band (2.0 StdDev), indicating an overextended move to the downside.
Momentum Reset: RSI is strictly oversold and hooking up, signaling stabilizing momentum.
Algo Confirmation: My custom quantitative model triggered a mechanical entry signal (Green Arrow), validating that internal volume metrics support a bounce.
Structural Support: We identified a volatility floor around the $278 - $280 level (see red line on chart).
The Strategy (Income): Instead of buying the dip aggressively, we utilize the high Implied Volatility to sell Puts at or below the structural support level. This generates theta (time decay) profit even if the stock consolidates.
Thesis: Theta Decay + Mean Reversion.
Disclaimer: Educational analysis only. Not financial advice.
交易結束:目標達成
UPDATE: Target Achieved | 7-Day HoldThe mean reversion thesis played out textbook-perfect. Over a 5-bar window (7 calendar days), the stock remained anchored above structural support at $278–$280, with premium compression accelerating toward our income target.
Entry to Close:
Held through expiration window without ITM drift
Peak risk occurred intraday; support held firm through Friday
Price began stress on following Monday, but position had already locked in theta decay profits well before deterioration
Mechanical Validation:
✓ Volatility floor identified correctly
✓ Duration: 7 days (sufficient for premium crush)
✓ Thesis confirmed: mean reversion + theta decay
Position closed. Mechanics validated.

ThetaLoop | Algorithmic Options Research
🔍 Free CSP Score for any ticker — X-Ray Scanner:
thetaloop.app/xray
(Not financial advice)
🔍 Free CSP Score for any ticker — X-Ray Scanner:
thetaloop.app/xray
(Not financial advice)
免責聲明
這些資訊和出版物並非旨在提供,也不構成TradingView提供或認可的任何形式的財務、投資、交易或其他類型的建議或推薦。請閱讀使用條款以了解更多資訊。
ThetaLoop | Algorithmic Options Research
🔍 Free CSP Score for any ticker — X-Ray Scanner:
thetaloop.app/xray
(Not financial advice)
🔍 Free CSP Score for any ticker — X-Ray Scanner:
thetaloop.app/xray
(Not financial advice)
免責聲明
這些資訊和出版物並非旨在提供,也不構成TradingView提供或認可的任何形式的財務、投資、交易或其他類型的建議或推薦。請閱讀使用條款以了解更多資訊。