
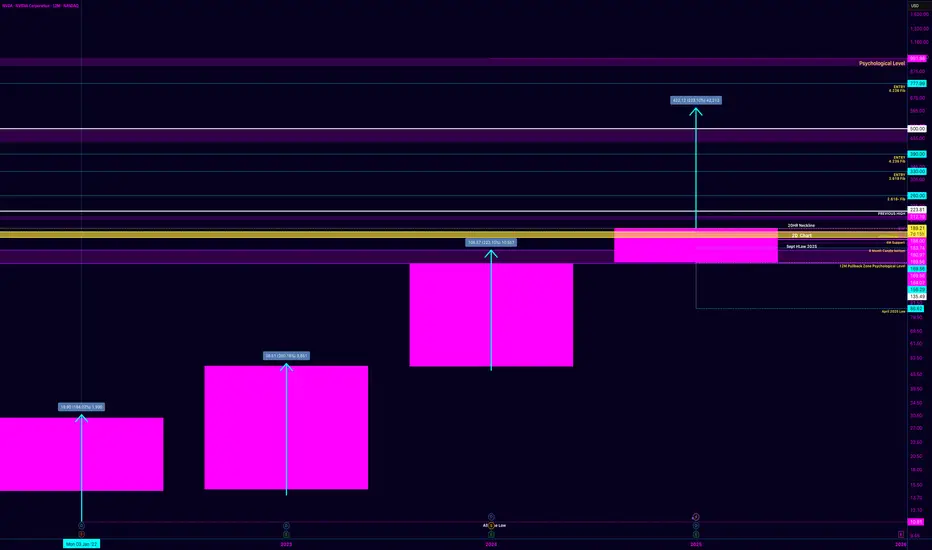
I want to expand on my NVDA thesis by adding one more layer that’s been on my mind — the 223.10% measurement — and how I’m viewing it strictly as a structural possibility, not a prediction.
Everything below is still rooted in market structure and timing.
Quick Recap: Where We Are
Price ran from the $164 region into the $212 highs, then pulled back into the $169–$174 demand zone. That pullback reset momentum and held structure across higher timeframes (2D, 4M, 6M).
From my perspective:
The downside move completed the reset
The market is now compressing
This is pre-breakout behavior, not a failure
The W formation is forming, but not confirmed.
Key Confirmation Still Hasn’t Changed
This remains true regardless of any upside theory:
➡️ Daily close + acceptance above ~$188
Until that happens, price is coiling.
Above that level, the path back to $212 opens structurally.
The 223.10% Theory (How I’m Looking at It)
This part is pure structure math, not expectation.
The previous large expansion candle on the higher timeframe measured approximately 223.10% from its base to its high.
Instead of projecting randomly, I asked a simple question:
What happens if the market repeats the same magnitude of expansion from the current structural base?
So I:
Took the 223.10% expansion
Anchored it to the current price zone (~$189 area)
Projected it upward mechanically
That projection lands in the ~$600–$610 region.
Important clarification:
This is not a forecast
This is not a target
This is a measured possibility, based on prior behavior
Markets don’t repeat perfectly — but they do rhyme, especially on higher timeframes.
Why Timing Makes This Interesting (But Still Uncertain)
The 12-month candle closes in ~7 days.
That matters.
If the market wanted to:
Reclaim $212
Print strength into the yearly close
Signal continuation into the next cycle
This is when it would begin positioning — not after the candle closes.
That said:
Expansion of that magnitude would require momentum confirmation
No confirmation yet = no assumption
Structure comes first. Always.
How I’m Framing This Mentally
I’m not expecting a miracle candle.
I’m not forcing an outcome.
My framework is:
Hold support
Break and accept key levels
Let expansion earn its way higher
If price can’t reclaim $212, the 223.10% theory stays just that — a theory.
But if it does?
Then the market itself opens the conversation.
Final Thought
This thesis isn’t about being right — it’s about being positioned correctly when structure aligns with time.
The homework was done earlier.
Now it’s about watching execution into the close.
Let the market decide.
-MoNi

相關出版品
免責聲明
這些資訊和出版物並非旨在提供,也不構成TradingView提供或認可的任何形式的財務、投資、交易或其他類型的建議或推薦。請閱讀使用條款以了解更多資訊。