
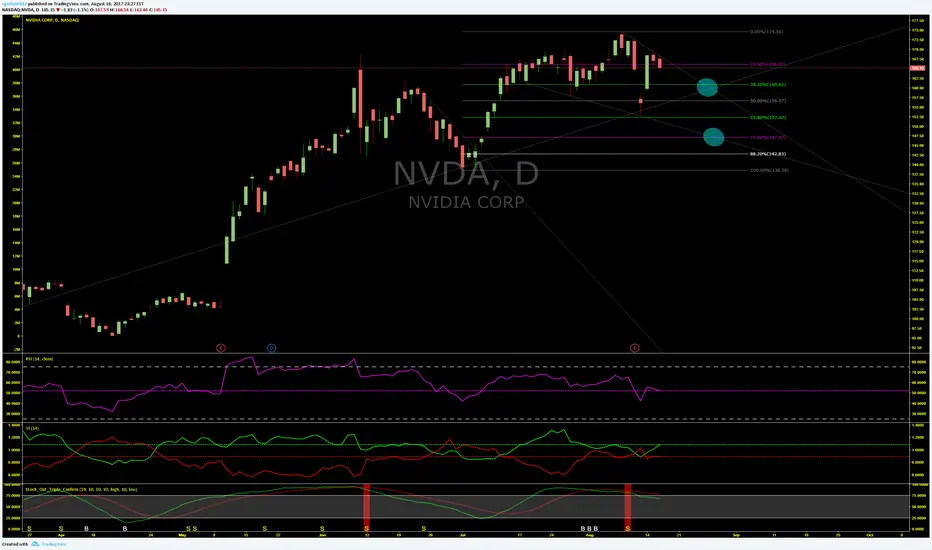
NVDA has been trending down since before their earnings call. Even though the drop might not be significant, I am using trend lines and Fibonacci levels to determine a minimal drop. The most likely drop that conforms with the trends and Fib retracement levels is at least to 160.82. If it goes beneath this level and below the trendline, A more significant drop would be in the making. It is possible the stock could drop further to 147.07. Anything beyond this should be (but probably won't) a major red flag for traders.

All forecasts are based on analysis of past behavior. Prior movements are not always indicative of future movement. Develop the theory, test the theory. Do your own research. Nothing in this analysis constitutes advice. YouTube For More. Good luck!!
免責聲明
這些資訊和出版物並非旨在提供,也不構成TradingView提供或認可的任何形式的財務、投資、交易或其他類型的建議或推薦。請閱讀使用條款以了解更多資訊。