

Back in November, I shared with you the bearish outlook on NVDA
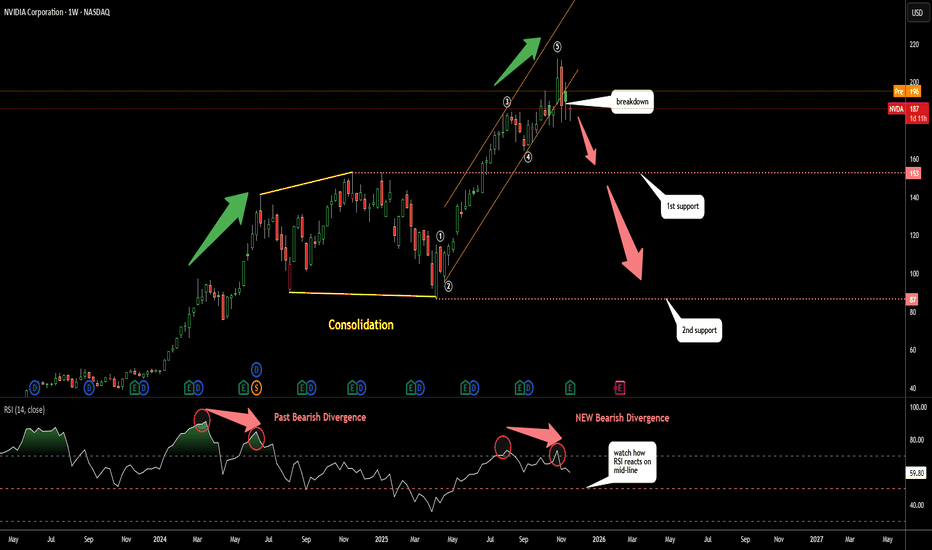
Recently we've got an early harbinger as I spotted a well-known reversal pattern that regularly appears after impulse reaches its climax and starts to reverse
Head & Shoulders reversal pattern (orange lines) is in the making on the weekly chart
We have 3 peaks with the highest in between forming the Head
The right shoulder was not built yet as the price should drop back to the Neckline
The bearish trigger set at the breakdown of the Neckline around $173
The target for H&S pattern is located at $129
It is calculated as the height of the Head subtracted from the Neckline breakdown point
Recently we've got an early harbinger as I spotted a well-known reversal pattern that regularly appears after impulse reaches its climax and starts to reverse
Head & Shoulders reversal pattern (orange lines) is in the making on the weekly chart
We have 3 peaks with the highest in between forming the Head
The right shoulder was not built yet as the price should drop back to the Neckline
The bearish trigger set at the breakdown of the Neckline around $173
The target for H&S pattern is located at $129
It is calculated as the height of the Head subtracted from the Neckline breakdown point

免責聲明
這些資訊和出版物並非旨在提供,也不構成TradingView提供或認可的任何形式的財務、投資、交易或其他類型的建議或推薦。請閱讀使用條款以了解更多資訊。