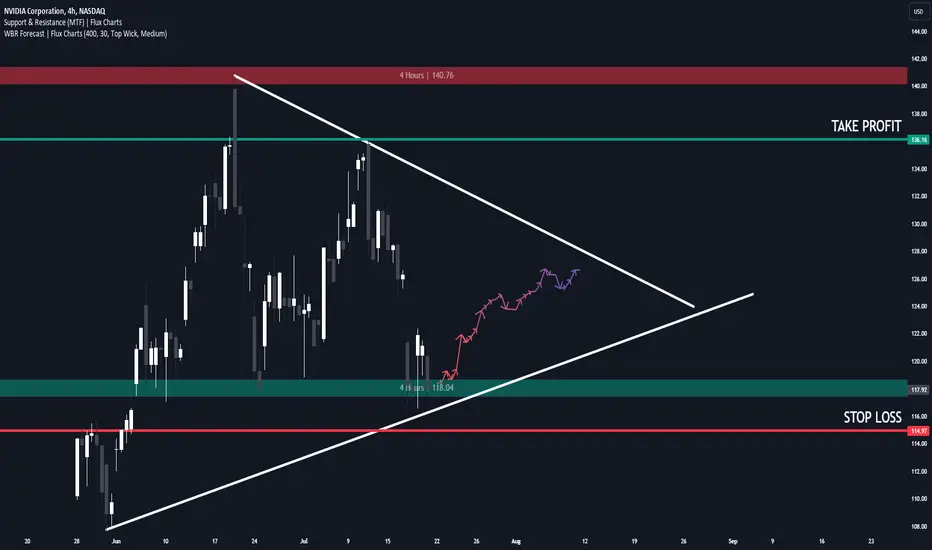
Why I am bullish on  NVDA
On the 4 hour timeframe:
- Retesting support zone
- Bottom of bullish pennant chart pattern
- Wick-to-body forecast is bullish
My personal trade:
Stop Loss / Take Profits:
- Entry: $118.00
- Take Profit: $136.16
- Stop Loss: $114.97
NVDAOn the 4 hour timeframe:
- Retesting support zone
- Bottom of bullish pennant chart pattern
- Wick-to-body forecast is bullish
My personal trade:
Stop Loss / Take Profits:
- Entry: $118.00
- Take Profit: $136.16
- Stop Loss: $114.97
註釋
Scaling some profits and moving SL to entry.
Access Flux Charts' exclusive indicators: fluxcharts.com/
Join our Discord community: discord.gg/FluxCharts
Join our Discord community: discord.gg/FluxCharts
免責聲明
這些資訊和出版物並非旨在提供,也不構成TradingView提供或認可的任何形式的財務、投資、交易或其他類型的建議或推薦。請閱讀使用條款以了解更多資訊。
Access Flux Charts' exclusive indicators: fluxcharts.com/
Join our Discord community: discord.gg/FluxCharts
Join our Discord community: discord.gg/FluxCharts
免責聲明
這些資訊和出版物並非旨在提供,也不構成TradingView提供或認可的任何形式的財務、投資、交易或其他類型的建議或推薦。請閱讀使用條款以了解更多資訊。