做空
Can Aggressive Elliott Wave View In Nikkei Will Play Out?
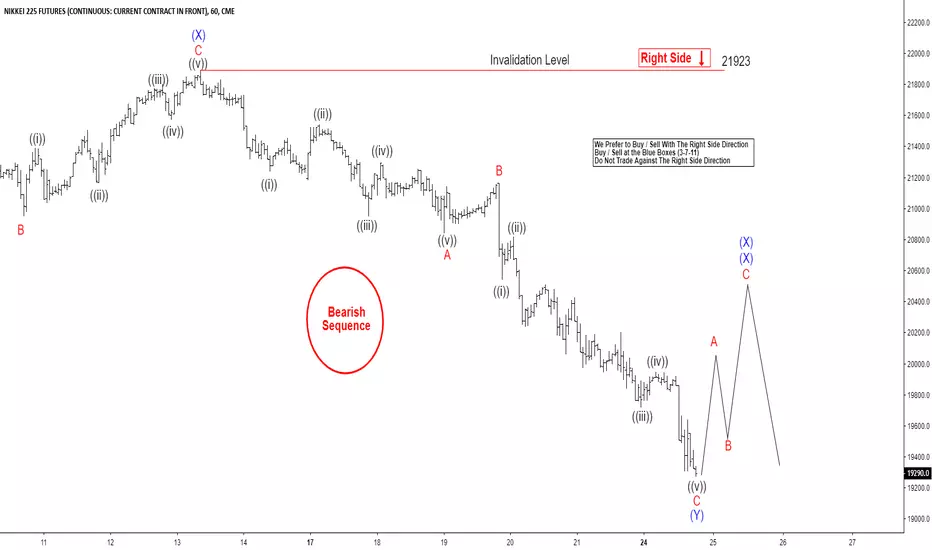
Nikkei short-term Elliott wave view suggests that the cycle from 10/01/2018 peak is showing 5 swings bearish sequence. This favor more downside to 19073-16773 100%-123.6% Fibonacci extension area to be reached in 7 swings before support for bigger 3 wave bounce is seen at least. The decline from 10/01 peak is showing overlapping price action thus suggests that decline is unfolding in a corrective sequence i.e could be unfolding as double three structure.
Currently, the decline to 21075 low blue wave (W) lower. Above from there, a bounce in blue wave (X) took place as a Flat correction where red wave A ended at 21735 high. Wave B ended at 20950 low and red wave C ended at 21923 high which also completed blue wave (X). Down from there, blue wave (Y) can be completed at 19278 low. Above from there the index is expected to do a bounce in 3, 7 or 11 swings within blue (X)(X) of a possible triple correction lower. We expect short-term sellers to appear in 3, 7 or 11 swings on a bounce in blue wave (X)(X).
Currently, the decline to 21075 low blue wave (W) lower. Above from there, a bounce in blue wave (X) took place as a Flat correction where red wave A ended at 21735 high. Wave B ended at 20950 low and red wave C ended at 21923 high which also completed blue wave (X). Down from there, blue wave (Y) can be completed at 19278 low. Above from there the index is expected to do a bounce in 3, 7 or 11 swings within blue (X)(X) of a possible triple correction lower. We expect short-term sellers to appear in 3, 7 or 11 swings on a bounce in blue wave (X)(X).

免責聲明
這些資訊和出版物並非旨在提供,也不構成TradingView提供或認可的任何形式的財務、投資、交易或其他類型的建議或推薦。請閱讀使用條款以了解更多資訊。
免責聲明
這些資訊和出版物並非旨在提供,也不構成TradingView提供或認可的任何形式的財務、投資、交易或其他類型的建議或推薦。請閱讀使用條款以了解更多資訊。