

Hey guys,
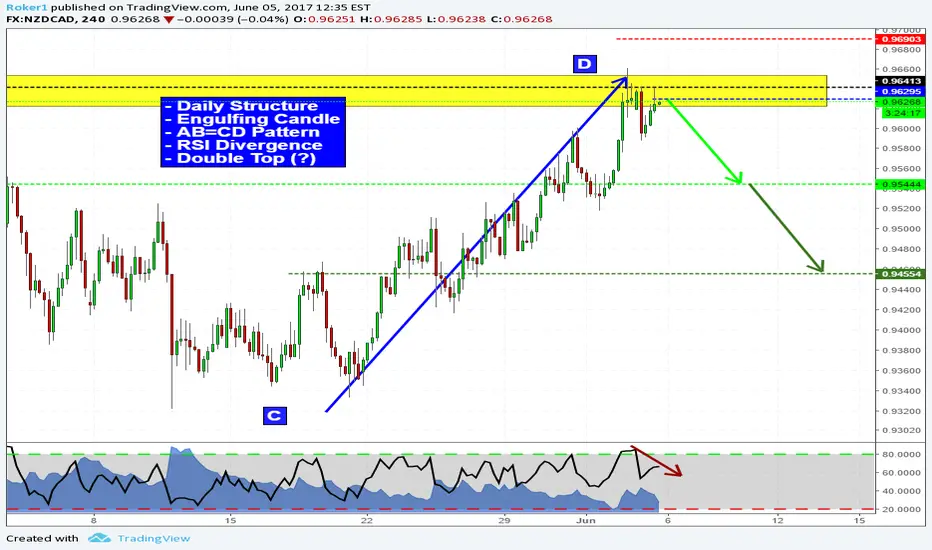
this is the 4hr chart on NZDCAD but my analysis, as usual, starts from higher timeframes: on the daily price has just touched a key level of structure (yellow box) along with the D point of an AB=CD pattern. As we go on lower timeframes such as 4hr you can see price has formed a pinbar followed by an engulfing red candle in overbought condition. Then at the retest of the highs we see RSI divergence and less strength in price action.
These are all good signs for a reversal. Let's see how it plays out.
Stops above highs, targets as displayed above.
If you have any question or if you want to share your view, feel free to comment below.
Otherwise, see you in the next chart!
this is the 4hr chart on NZDCAD but my analysis, as usual, starts from higher timeframes: on the daily price has just touched a key level of structure (yellow box) along with the D point of an AB=CD pattern. As we go on lower timeframes such as 4hr you can see price has formed a pinbar followed by an engulfing red candle in overbought condition. Then at the retest of the highs we see RSI divergence and less strength in price action.
These are all good signs for a reversal. Let's see how it plays out.
Stops above highs, targets as displayed above.
If you have any question or if you want to share your view, feel free to comment below.
Otherwise, see you in the next chart!
交易結束:達到停損點

免責聲明
這些資訊和出版物並非旨在提供,也不構成TradingView提供或認可的任何形式的財務、投資、交易或其他類型的建議或推薦。請閱讀使用條款以了解更多資訊。