

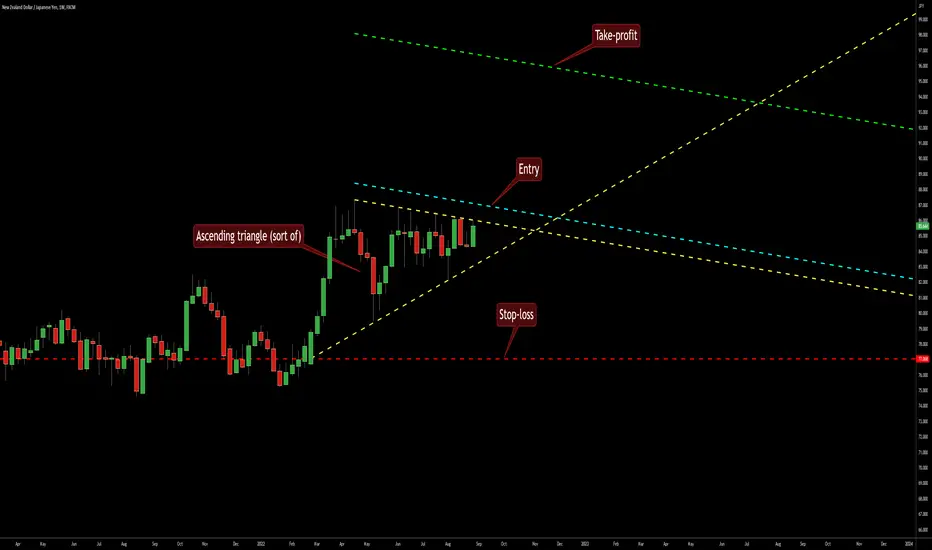
This pattern on the weekly chart of NZD/JPY resembles a mix of ascending and symmetrical triangles and provides a bullish breakout trading opportunity. The triangle's borders are marked with the yellow lines. My potential entry is marked with the cyan line. My potential take-profit level is marked with the green line. The stop-loss is to be set to the triangle's low at 77.068.
交易進行
Long entry triggered today at 10:00 UTC with entry at 87.033, SL at 77.068, and TP at 96.712 (will be going down each week).手動結束交易
Closed by time-out today at 83.097.
You can find useful tools to detect, build, and trade chart patterns - all completely free on earnforex.com.
免責聲明
這些資訊和出版物並非旨在提供,也不構成TradingView提供或認可的任何形式的財務、投資、交易或其他類型的建議或推薦。請閱讀使用條款以了解更多資訊。
You can find useful tools to detect, build, and trade chart patterns - all completely free on earnforex.com.
免責聲明
這些資訊和出版物並非旨在提供,也不構成TradingView提供或認可的任何形式的財務、投資、交易或其他類型的建議或推薦。請閱讀使用條款以了解更多資訊。