

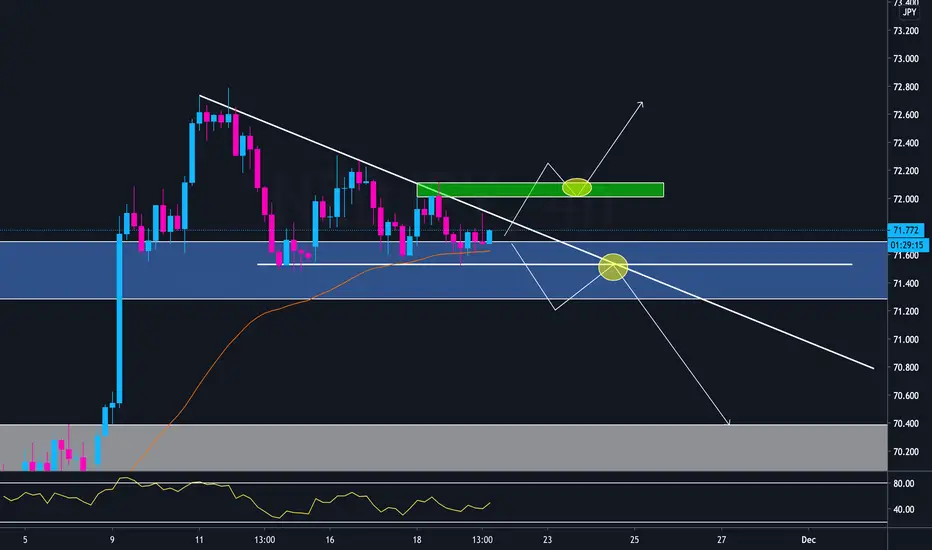
NZDJPY is showing a descending triangle formation at a key area of resistance. When we zoom out to the weekly, we can see the previous weekly candle showed a rejection of this zone and the current weekly candle is showing low bullish momentum. This pair has more potential to breakout to the downside rather than the upside but the market can do whatever it wants. For sells i'll be looking for a break of support and a retest, for buys i'll look for a break and retest of resistance.

免責聲明
這些資訊和出版物並非旨在提供,也不構成TradingView提供或認可的任何形式的財務、投資、交易或其他類型的建議或推薦。請閱讀使用條款以了解更多資訊。