
There is a saying in the markets:
"The chart is the same. The story changes with the timeframe."
Oil India reminded me of this over the last few weeks.
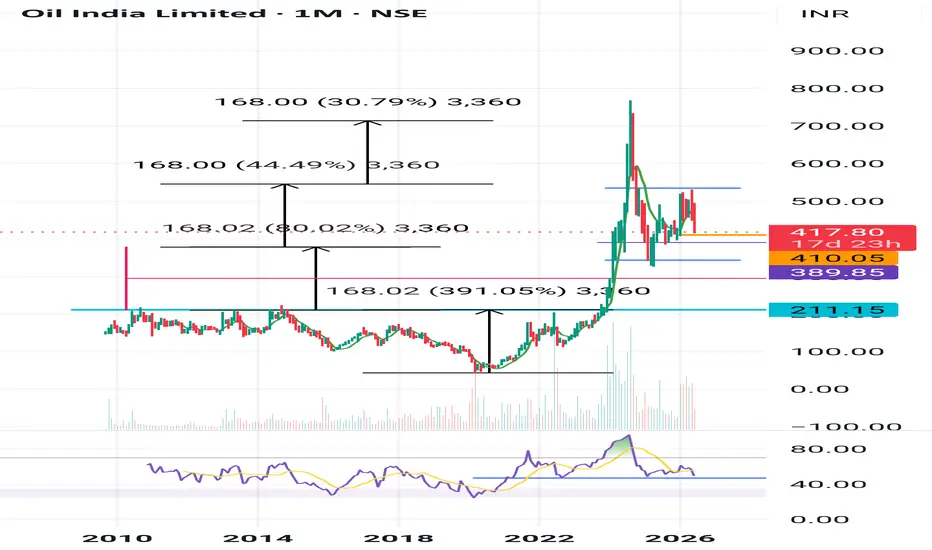
On the monthly chart, I see a company that went through years of consolidation, broke out, and rewarded patient investors with a massive move.
From the post-COVID lows, the stock multiplied several times. Discoveries in Rajasthan. Discoveries in the Andaman Sea. Strong cash flows. Attractive dividends. Improving exploration prospects.
The long-term story looked intact.
Then I zoomed in.
The daily chart showed something very different.
Supports started breaking.
Gap-down candles appeared.
The ₹490 zone gave way.
The ₹470 support failed.
Momentum weakened.
Options data turned bearish.
Sentiment shifted from optimism to fear within days.
Nothing about the company changed overnight.
But the market's expectations did.
And that's the lesson.
Markets don't move in straight lines.
A stock can be fundamentally strong and technically weak at the same time.
It can have exciting headlines and still fall 15–20%.
It can test the conviction of long-term investors while creating opportunities for traders.
As someone who has been tracking Oil India closely, this episode reinforced three things for me:
1. Price is the final truth.
2. Timeframe determines perspective.
3. Conviction without risk management is dangerous.
Today, the debate isn't whether Oil India is a "good" or "bad" company.
The real question is:
Are we witnessing a normal correction within a larger cycle, or the early signs of a much deeper reset?
Only time will answer that.
Until then, I remain a student of the market.
Because sometimes the biggest lessons don't come from the winners.
They come from the positions that force us to think deeper.
"The chart is the same. The story changes with the timeframe."
Oil India reminded me of this over the last few weeks.
On the monthly chart, I see a company that went through years of consolidation, broke out, and rewarded patient investors with a massive move.
From the post-COVID lows, the stock multiplied several times. Discoveries in Rajasthan. Discoveries in the Andaman Sea. Strong cash flows. Attractive dividends. Improving exploration prospects.
The long-term story looked intact.
Then I zoomed in.
The daily chart showed something very different.
Supports started breaking.
Gap-down candles appeared.
The ₹490 zone gave way.
The ₹470 support failed.
Momentum weakened.
Options data turned bearish.
Sentiment shifted from optimism to fear within days.
Nothing about the company changed overnight.
But the market's expectations did.
And that's the lesson.
Markets don't move in straight lines.
A stock can be fundamentally strong and technically weak at the same time.
It can have exciting headlines and still fall 15–20%.
It can test the conviction of long-term investors while creating opportunities for traders.
As someone who has been tracking Oil India closely, this episode reinforced three things for me:
1. Price is the final truth.
2. Timeframe determines perspective.
3. Conviction without risk management is dangerous.
Today, the debate isn't whether Oil India is a "good" or "bad" company.
The real question is:
Are we witnessing a normal correction within a larger cycle, or the early signs of a much deeper reset?
Only time will answer that.
Until then, I remain a student of the market.
Because sometimes the biggest lessons don't come from the winners.
They come from the positions that force us to think deeper.

免責聲明
這些資訊和出版物並非旨在提供,也不構成TradingView提供或認可的任何形式的財務、投資、交易或其他類型的建議或推薦。請閱讀使用條款以了解更多資訊。