
With conflict erupting in the Middle East over the weekend, the gap higher in oil prices is hardly surprising. But while sudden price moves tend to attract traders like moths to a flame, moments like this are exactly when context becomes most important.
Geopolitics jolts energy markets
Energy traders have been quick to price in the additional risk premium associated with the scale and significance of the weekend’s military action. With fears of escalation and potential supply disruption centred around the Strait of Hormuz, the sharp move higher in oil prices is not particularly surprising.
But when markets are being driven by rapidly evolving geopolitical developments, the day-to-day news flow can make it difficult to maintain a sense of the bigger picture. This is exactly where technical analysis can add value, helping traders step back from the headlines and understand where price is moving within the broader market structure.
The rally meets multi-year resistance
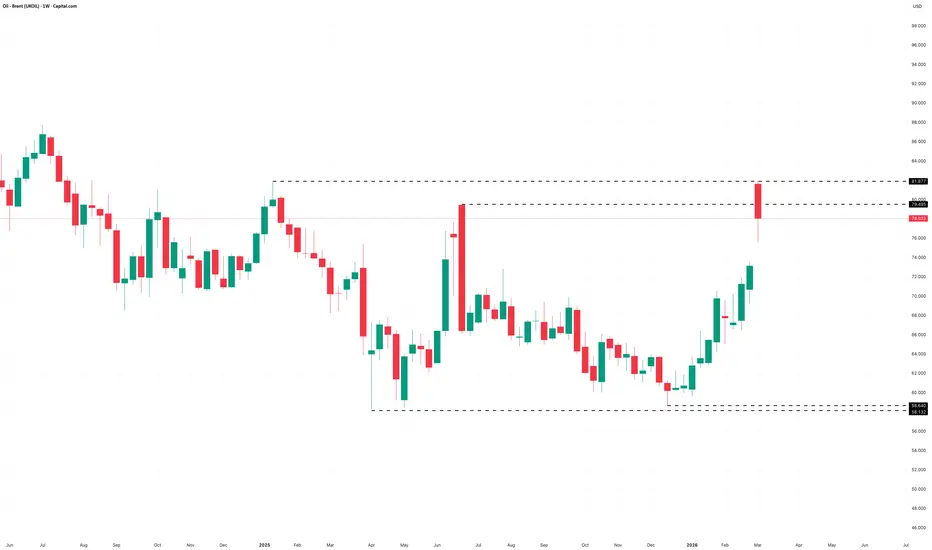
Looking at the weekly chart, the broader structure of the oil market over the past few years has been defined by a gradual sequence of lower swing highs. In simple terms, each rally has struggled to push beyond the previous peak, creating a gently downward-sloping structure on the higher timeframe.
That backdrop makes the current move particularly interesting. The geopolitical shock has propelled oil directly back into one of these higher-timeframe resistance zones, sitting just beneath the highs formed during previous rallies. In other words, the news has acted as the catalyst, but the market has arrived at a level that already carried significant technical weight.
The speed of the move also stands out. Momentum on the daily chart has surged as price rapidly pushed away from recent consolidation and into territory where previous advances have struggled to sustain follow-through. Moves like this often leave areas on the chart where price travelled quickly with relatively little trading activity, creating pockets of thin liquidity that markets sometimes revisit later.
From a structural perspective, this leaves oil at an interesting crossroads. If buyers can sustain momentum and push price through this resistance zone, it would mark a meaningful shift in the longer-term structure by breaking the pattern of lower highs that has defined the market in recent years. But if the rally begins to stall here, it would simply reinforce that same structure once again.
For traders, that makes the coming sessions particularly interesting. The headlines may have triggered the move, but the weekly chart suggests oil has now arrived at one of the most important technical decision points on the chart.
UKOIL Weekly Candle Chart

Past performance is not a reliable indicator of future results
UKOIL Daily Candle Chart

Past performance is not a reliable indicator of future results
Disclaimer: This is for information and learning purposes only. The information provided does not constitute investment advice nor take into account the individual financial circumstances or objectives of any investor. Any information that may be provided relating to past performance is not a reliable indicator of future results or performance. Social media channels are not relevant for UK residents.
Spread bets and CFDs are complex instruments and come with a high risk of losing money rapidly due to leverage. 85.24% of retail investor accounts lose money when trading spread bets and CFDs with this provider. You should consider whether you understand how spread bets and CFDs work and whether you can afford to take the high risk of losing your money.
Geopolitics jolts energy markets
Energy traders have been quick to price in the additional risk premium associated with the scale and significance of the weekend’s military action. With fears of escalation and potential supply disruption centred around the Strait of Hormuz, the sharp move higher in oil prices is not particularly surprising.
But when markets are being driven by rapidly evolving geopolitical developments, the day-to-day news flow can make it difficult to maintain a sense of the bigger picture. This is exactly where technical analysis can add value, helping traders step back from the headlines and understand where price is moving within the broader market structure.
The rally meets multi-year resistance
Looking at the weekly chart, the broader structure of the oil market over the past few years has been defined by a gradual sequence of lower swing highs. In simple terms, each rally has struggled to push beyond the previous peak, creating a gently downward-sloping structure on the higher timeframe.
That backdrop makes the current move particularly interesting. The geopolitical shock has propelled oil directly back into one of these higher-timeframe resistance zones, sitting just beneath the highs formed during previous rallies. In other words, the news has acted as the catalyst, but the market has arrived at a level that already carried significant technical weight.
The speed of the move also stands out. Momentum on the daily chart has surged as price rapidly pushed away from recent consolidation and into territory where previous advances have struggled to sustain follow-through. Moves like this often leave areas on the chart where price travelled quickly with relatively little trading activity, creating pockets of thin liquidity that markets sometimes revisit later.
From a structural perspective, this leaves oil at an interesting crossroads. If buyers can sustain momentum and push price through this resistance zone, it would mark a meaningful shift in the longer-term structure by breaking the pattern of lower highs that has defined the market in recent years. But if the rally begins to stall here, it would simply reinforce that same structure once again.
For traders, that makes the coming sessions particularly interesting. The headlines may have triggered the move, but the weekly chart suggests oil has now arrived at one of the most important technical decision points on the chart.
UKOIL Weekly Candle Chart
Past performance is not a reliable indicator of future results
UKOIL Daily Candle Chart
Past performance is not a reliable indicator of future results
Disclaimer: This is for information and learning purposes only. The information provided does not constitute investment advice nor take into account the individual financial circumstances or objectives of any investor. Any information that may be provided relating to past performance is not a reliable indicator of future results or performance. Social media channels are not relevant for UK residents.
Spread bets and CFDs are complex instruments and come with a high risk of losing money rapidly due to leverage. 85.24% of retail investor accounts lose money when trading spread bets and CFDs with this provider. You should consider whether you understand how spread bets and CFDs work and whether you can afford to take the high risk of losing your money.

免責聲明
這些資訊和出版物並非旨在提供,也不構成TradingView提供或認可的任何形式的財務、投資、交易或其他類型的建議或推薦。請閱讀使用條款以了解更多資訊。
免責聲明
這些資訊和出版物並非旨在提供,也不構成TradingView提供或認可的任何形式的財務、投資、交易或其他類型的建議或推薦。請閱讀使用條款以了解更多資訊。