
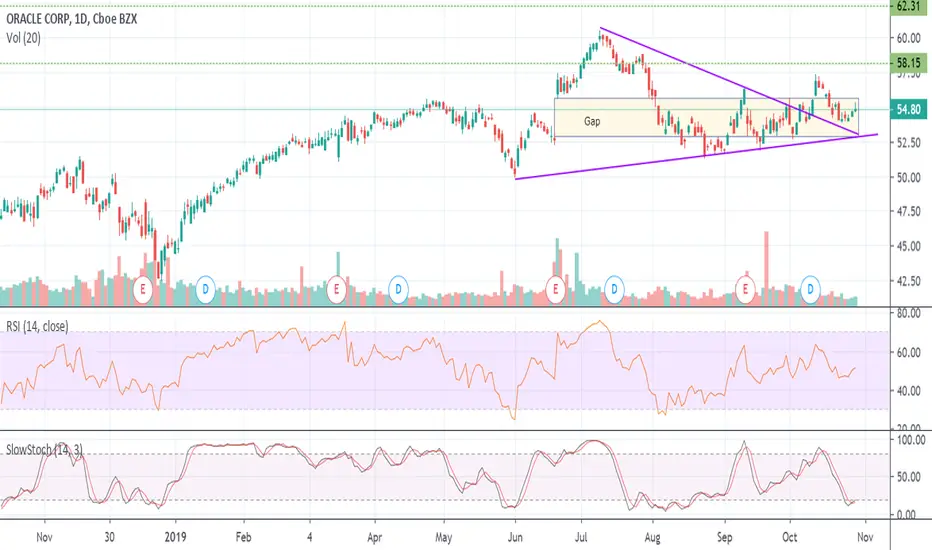
The stock has created a symmetrical triangle pattern since the beginning of June. Also mixed into this pattern is an earnings gap halfway through the month. The price has continued to trade within this gap range but the consolidation has led to the stock price moving out of the triangle pattern. The recent pullback, while remaining in the gap zone, is now testing the previous triangle resistance line as support. The stock is also exiting an oversold position.
I have two Fibonacci Extension levels targeted. The 61.8% & 100% levels are noted by the dashed green lines should the bullish move continue.
I have two Fibonacci Extension levels targeted. The 61.8% & 100% levels are noted by the dashed green lines should the bullish move continue.

免責聲明
這些資訊和出版物並非旨在提供,也不構成TradingView提供或認可的任何形式的財務、投資、交易或其他類型的建議或推薦。請閱讀使用條款以了解更多資訊。
免責聲明
這些資訊和出版物並非旨在提供,也不構成TradingView提供或認可的任何形式的財務、投資、交易或其他類型的建議或推薦。請閱讀使用條款以了解更多資訊。