
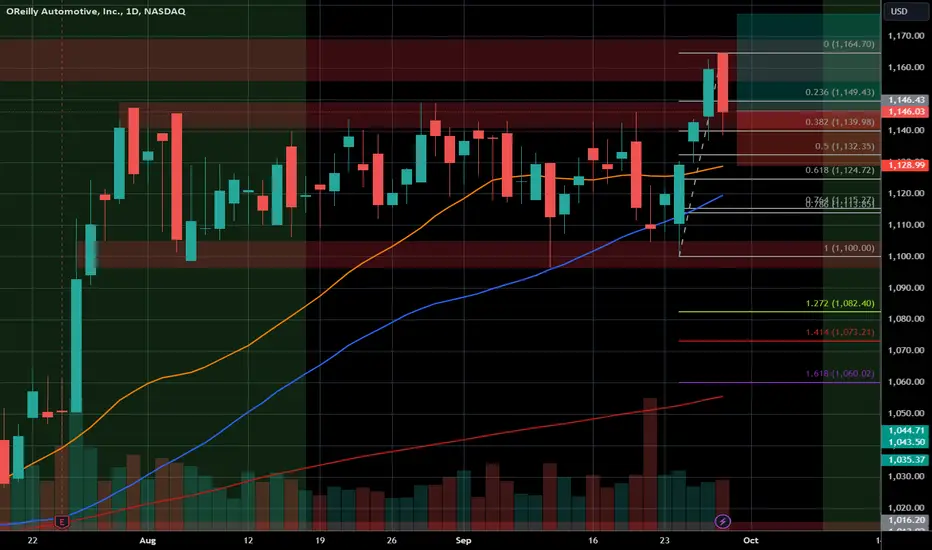
I've entered a long position in $ORLY. Since this US stock reached its high in late July of this year, it has been continuously in a sideways correction, which is very bullish. In the last few trading days, it broke out of this channel to the upside and re-tested it on the last trading day.
The price is currently supported by the 38.2% Fibonacci level, the upper boundary of the broken channel, and the moving averages are catching up.
Let's see if this setup plays out as expected.
The price is currently supported by the 38.2% Fibonacci level, the upper boundary of the broken channel, and the moving averages are catching up.
Let's see if this setup plays out as expected.
手動結束交易
Closed the position with a green 0
免責聲明
這些資訊和出版物並非旨在提供,也不構成TradingView提供或認可的任何形式的財務、投資、交易或其他類型的建議或推薦。請閱讀使用條款以了解更多資訊。