
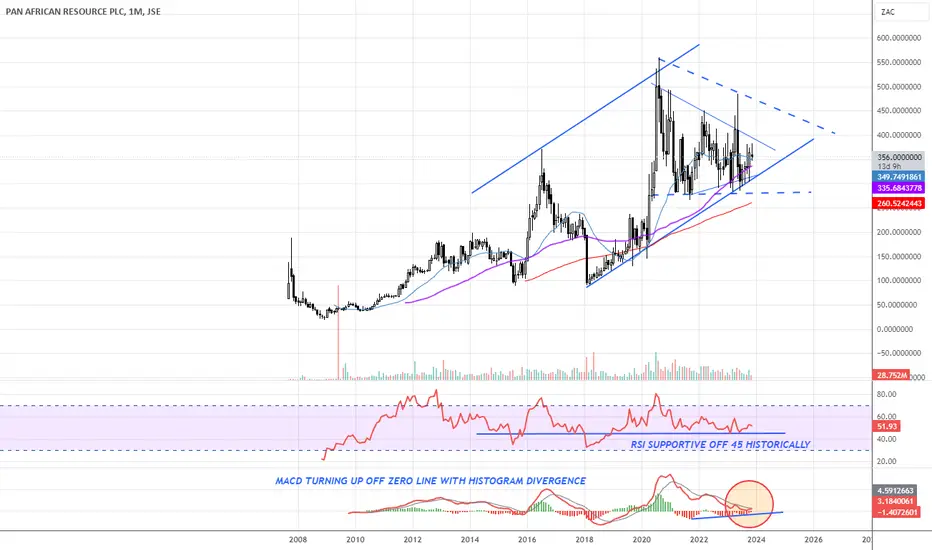
This has to be one of the best looking Gold mining stocks you are going to find. Since 2008 it has consistently moved higher, something not often see in this volatile sector. A well-run operation and the chart proves just that.
As this is a monthly chart, the time on this is more longer-term in nature but I think It's not a bad stock to put in the bottom drawer and forget about it. With gold looking likely to blast above $2000 in the next few weeks or months, this stock can be a massive beneficiary of such a spike in the gold price.
Chart has been in a solid uptrend with an increasing >50 month ma, higher lows and looks to be consolidating now with a sold base at R2.80-R3.00. It has also bounced off the uptrend from 2018 and also seems to be forming a triangle formation if you looking at closing prices. Triangles are generally bullish continuation patterns with an expectation for the next move to continue in the direction of the preceding move which is up. Comments on the indicators can be seen on the chart and also supports the constructive price action.
All in all - I think this is a great setup for a medium-longer term hold.
As this is a monthly chart, the time on this is more longer-term in nature but I think It's not a bad stock to put in the bottom drawer and forget about it. With gold looking likely to blast above $2000 in the next few weeks or months, this stock can be a massive beneficiary of such a spike in the gold price.
Chart has been in a solid uptrend with an increasing >50 month ma, higher lows and looks to be consolidating now with a sold base at R2.80-R3.00. It has also bounced off the uptrend from 2018 and also seems to be forming a triangle formation if you looking at closing prices. Triangles are generally bullish continuation patterns with an expectation for the next move to continue in the direction of the preceding move which is up. Comments on the indicators can be seen on the chart and also supports the constructive price action.
All in all - I think this is a great setup for a medium-longer term hold.

"If you do what you love, you'll never work a day in your life" - Marc Anthony
免責聲明
這些資訊和出版物並非旨在提供,也不構成TradingView提供或認可的任何形式的財務、投資、交易或其他類型的建議或推薦。請閱讀使用條款以了解更多資訊。
"If you do what you love, you'll never work a day in your life" - Marc Anthony
免責聲明
這些資訊和出版物並非旨在提供,也不構成TradingView提供或認可的任何形式的財務、投資、交易或其他類型的建議或推薦。請閱讀使用條款以了解更多資訊。