
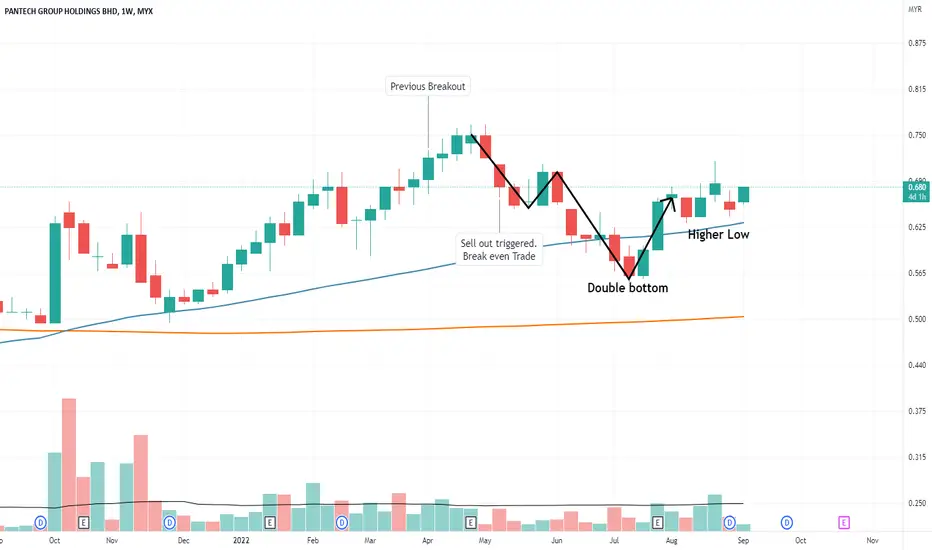
I shared PANTECH chart back then in 30th March (link below). The breakout doesn't last long and sell out was triggered due to break support. This is a breakeven trade back then.
The chart that formed a double bottom. And recently higher low is observed with volume start to come in. QR look decent too. Will PANTECH further attack?
Disclaimer:
Information presented here is not intended to be used as the sole basis of any investment decisions nor should it be construed as advice designed to meet the investment need of any investor. Trade at your own risk.
The chart that formed a double bottom. And recently higher low is observed with volume start to come in. QR look decent too. Will PANTECH further attack?
Disclaimer:
Information presented here is not intended to be used as the sole basis of any investment decisions nor should it be construed as advice designed to meet the investment need of any investor. Trade at your own risk.
註釋
Breakout 0.860 beginning of Sep. Pulling back since then to re-test 0.860 as support.
免責聲明
這些資訊和出版物並非旨在提供,也不構成TradingView提供或認可的任何形式的財務、投資、交易或其他類型的建議或推薦。請閱讀使用條款以了解更多資訊。