
🧭 Timeframe & Context
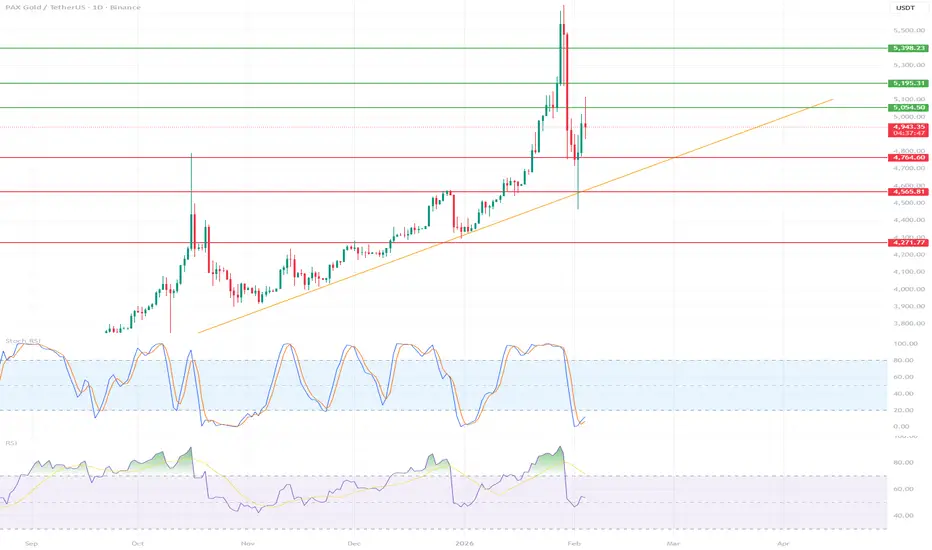
PAXG / USDT – D1
Strong uptrend for many months (clear HH/HL sequence)
Last move: impulse + very aggressive correction (long wick + dump)
📈 Main Trend
The uptrend is still in effect, but:
The market is in a correction phase after the euphoria
The short-term structure has been breached
🟠 Trendline (orange)
Price has broken below / is testing it from above → a key decision point
🔑 Levels (most important)
🟢 Resistance
5,054 – local resistance / reaction zone
5,195 – 5,235 – strong supply zone (this was a fake breakout)
5,398 – ATH / market ceiling
🔴 Support
4,960 – 4 950 – current combat zone
4,764 – very important HL (loss = deeper correction)
4,565 – key structural support
4,277 – "last line of defense" of the D1 trend
📉 RSI & Stoch RSI
RSI (D1)
Drop from high levels → market cooling
Still above 50 → uptrend not broken yet
No bullish divergence (yet)
Stoch RSI
Coming out of oversold
This offers potential for a short-term bounce, but:
bounce ≠ trend reversal
🧠 What's really happening here?
This is a classic pattern:
🚀 Strong impulse (FOMO)
❌ False breakout + liquidity dump
🔄 The market is testing whether the bulls still have fuel
🎯 Scenarios
🟢 Bullish (more likely if…)
We hold 4,950–4,960
We return above 5,054
Targets:
5,195
5,398 (ATH)
🔴 Bearish (if…)
D1 close below 4,764
Then:
4,565
4,277 as a deep pullback
PAXG / USDT – D1
Strong uptrend for many months (clear HH/HL sequence)
Last move: impulse + very aggressive correction (long wick + dump)
📈 Main Trend
The uptrend is still in effect, but:
The market is in a correction phase after the euphoria
The short-term structure has been breached
🟠 Trendline (orange)
Price has broken below / is testing it from above → a key decision point
🔑 Levels (most important)
🟢 Resistance
5,054 – local resistance / reaction zone
5,195 – 5,235 – strong supply zone (this was a fake breakout)
5,398 – ATH / market ceiling
🔴 Support
4,960 – 4 950 – current combat zone
4,764 – very important HL (loss = deeper correction)
4,565 – key structural support
4,277 – "last line of defense" of the D1 trend
📉 RSI & Stoch RSI
RSI (D1)
Drop from high levels → market cooling
Still above 50 → uptrend not broken yet
No bullish divergence (yet)
Stoch RSI
Coming out of oversold
This offers potential for a short-term bounce, but:
bounce ≠ trend reversal
🧠 What's really happening here?
This is a classic pattern:
🚀 Strong impulse (FOMO)
❌ False breakout + liquidity dump
🔄 The market is testing whether the bulls still have fuel
🎯 Scenarios
🟢 Bullish (more likely if…)
We hold 4,950–4,960
We return above 5,054
Targets:
5,195
5,398 (ATH)
🔴 Bearish (if…)
D1 close below 4,764
Then:
4,565
4,277 as a deep pullback

免責聲明
這些資訊和出版物並非旨在提供,也不構成TradingView提供或認可的任何形式的財務、投資、交易或其他類型的建議或推薦。請閱讀使用條款以了解更多資訊。
免責聲明
這些資訊和出版物並非旨在提供,也不構成TradingView提供或認可的任何形式的財務、投資、交易或其他類型的建議或推薦。請閱讀使用條款以了解更多資訊。