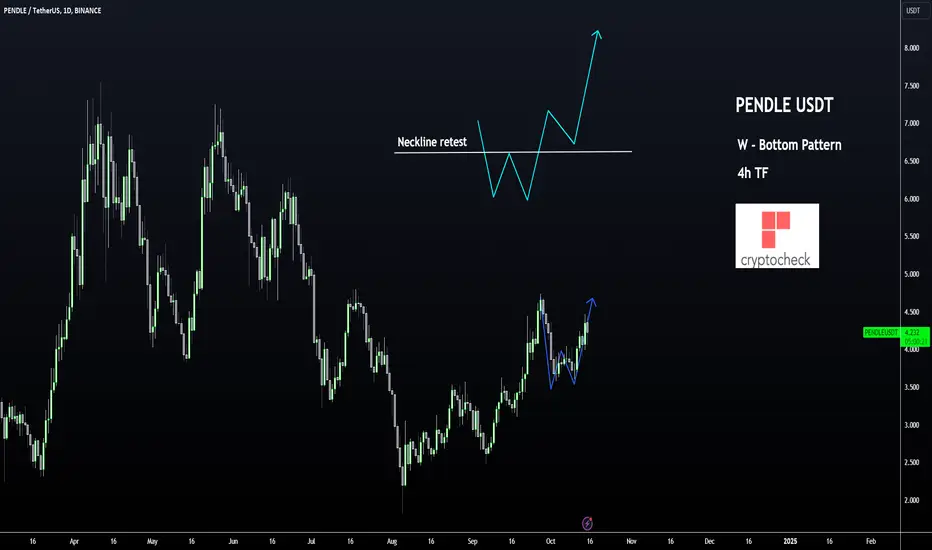
PENDLE has formed a W-Bottom Chart Pattern in the Daily timeframe, which could signal more upside is coming.
We're also observing very distinctive higher lows and higher highs; a key sign of a bullish market.
The W-Bottom pattern hasn't quite finished playing out, what we now need to see is a successful retest of support at the "neckline" which is currently at $4. What this means in simpler terms, is that the price cannot CLOSE below this, otherwise the pattern is invalidated.
We're also observing a BUY signal in the weekly timeframe; a strong indication that bulls are in control for the near future:

If the pattern holds, the price is likely heading towards the previous local high of $4.7

_______________________________

 PENDLEUSDT
We're also observing very distinctive higher lows and higher highs; a key sign of a bullish market.
The W-Bottom pattern hasn't quite finished playing out, what we now need to see is a successful retest of support at the "neckline" which is currently at $4. What this means in simpler terms, is that the price cannot CLOSE below this, otherwise the pattern is invalidated.
We're also observing a BUY signal in the weekly timeframe; a strong indication that bulls are in control for the near future:
If the pattern holds, the price is likely heading towards the previous local high of $4.7
_______________________________
PENDLEUSDT 
Discord Server
discord.gg/xHJRka3
Cryptocheck Website
thecryptocheck.com
SoftQuant Website
softquant.io
discord.gg/xHJRka3
Cryptocheck Website
thecryptocheck.com
SoftQuant Website
softquant.io
相關出版品
免責聲明
這些資訊和出版物並非旨在提供,也不構成TradingView提供或認可的任何形式的財務、投資、交易或其他類型的建議或推薦。請閱讀使用條款以了解更多資訊。
Discord Server
discord.gg/xHJRka3
Cryptocheck Website
thecryptocheck.com
SoftQuant Website
softquant.io
discord.gg/xHJRka3
Cryptocheck Website
thecryptocheck.com
SoftQuant Website
softquant.io
相關出版品
免責聲明
這些資訊和出版物並非旨在提供,也不構成TradingView提供或認可的任何形式的財務、投資、交易或其他類型的建議或推薦。請閱讀使用條款以了解更多資訊。